Dear crypto friends, I am your old friend 財庫! Recently, ETH has plummeted from $4000 to $3050, how many people are itching like a cat scratch? Are you shouting 'Long live the bottom fishing' every day, only to be trapped like a dog as soon as you enter the market? Today's hard-hitting analysis will help you see the truth—don't rush! The basement hasn't even hit the bottom yet!
1. Daily chart 'fake drop': seemingly gentle, but hiding deadly traps!
You see the ETH daily chart, it seems to be hovering around 3050, looking very much like it's about to bounce back:
Price: fluctuating repeatedly around $3055, very much like a scumbag's 'I'll give you one more chance'
Indicator: RSI is only 42 (far from oversold), MACD golden cross is weak like it has Parkinson’s
Moving averages: MA7 and MA25 loom like a mountain, MA99 is even higher, like a sword hanging over the head
The truth: Is this stabilization? Clearly, it's a trap set by the bears for the retail investors! It's like boxing, your opponent intentionally exposes a flaw, and when you leap in, it's a heavy punch!
2. Capital flight: The main forces are fleeing with the train overnight!
Look at this shocking flow of funds:
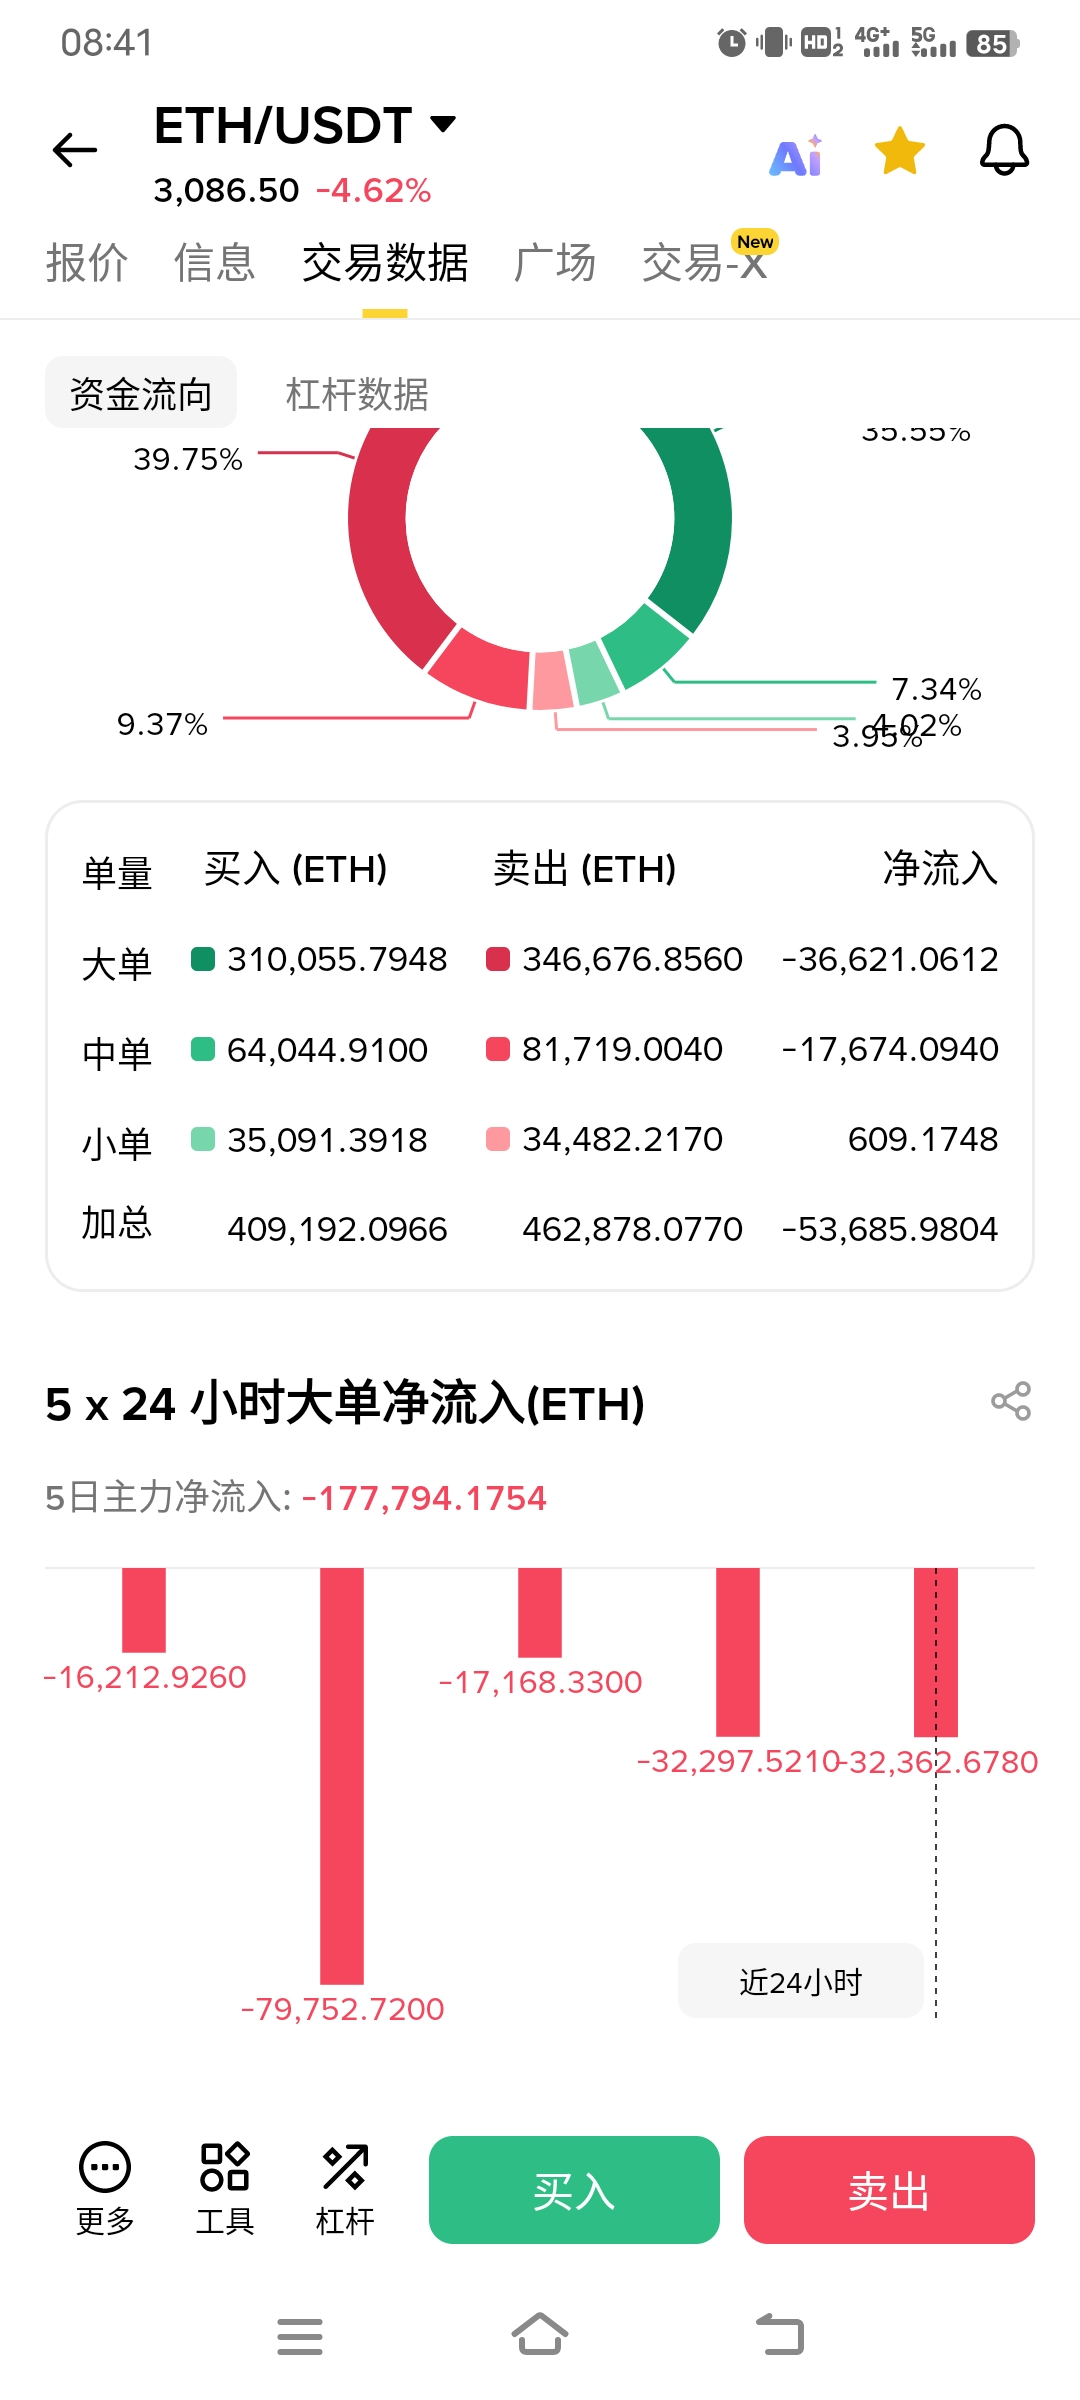
Total rout: Large orders, medium orders, small orders are all fleeing, with a daily net outflow of 72,000 ETH!
Main force retreat: 198,000 ETH dumped in 5 days, equivalent to emptying the entire Bitcoin exchange in Chengdu!
ETF explosion: US ETF sees a net outflow of $260 million in a single day, creating a historical level of panic
Bloody lesson: Prices can be faked, but the flow of funds cannot deceive people! Now even 'smart money' is jumping ship; do you still dare to be a bag holder?
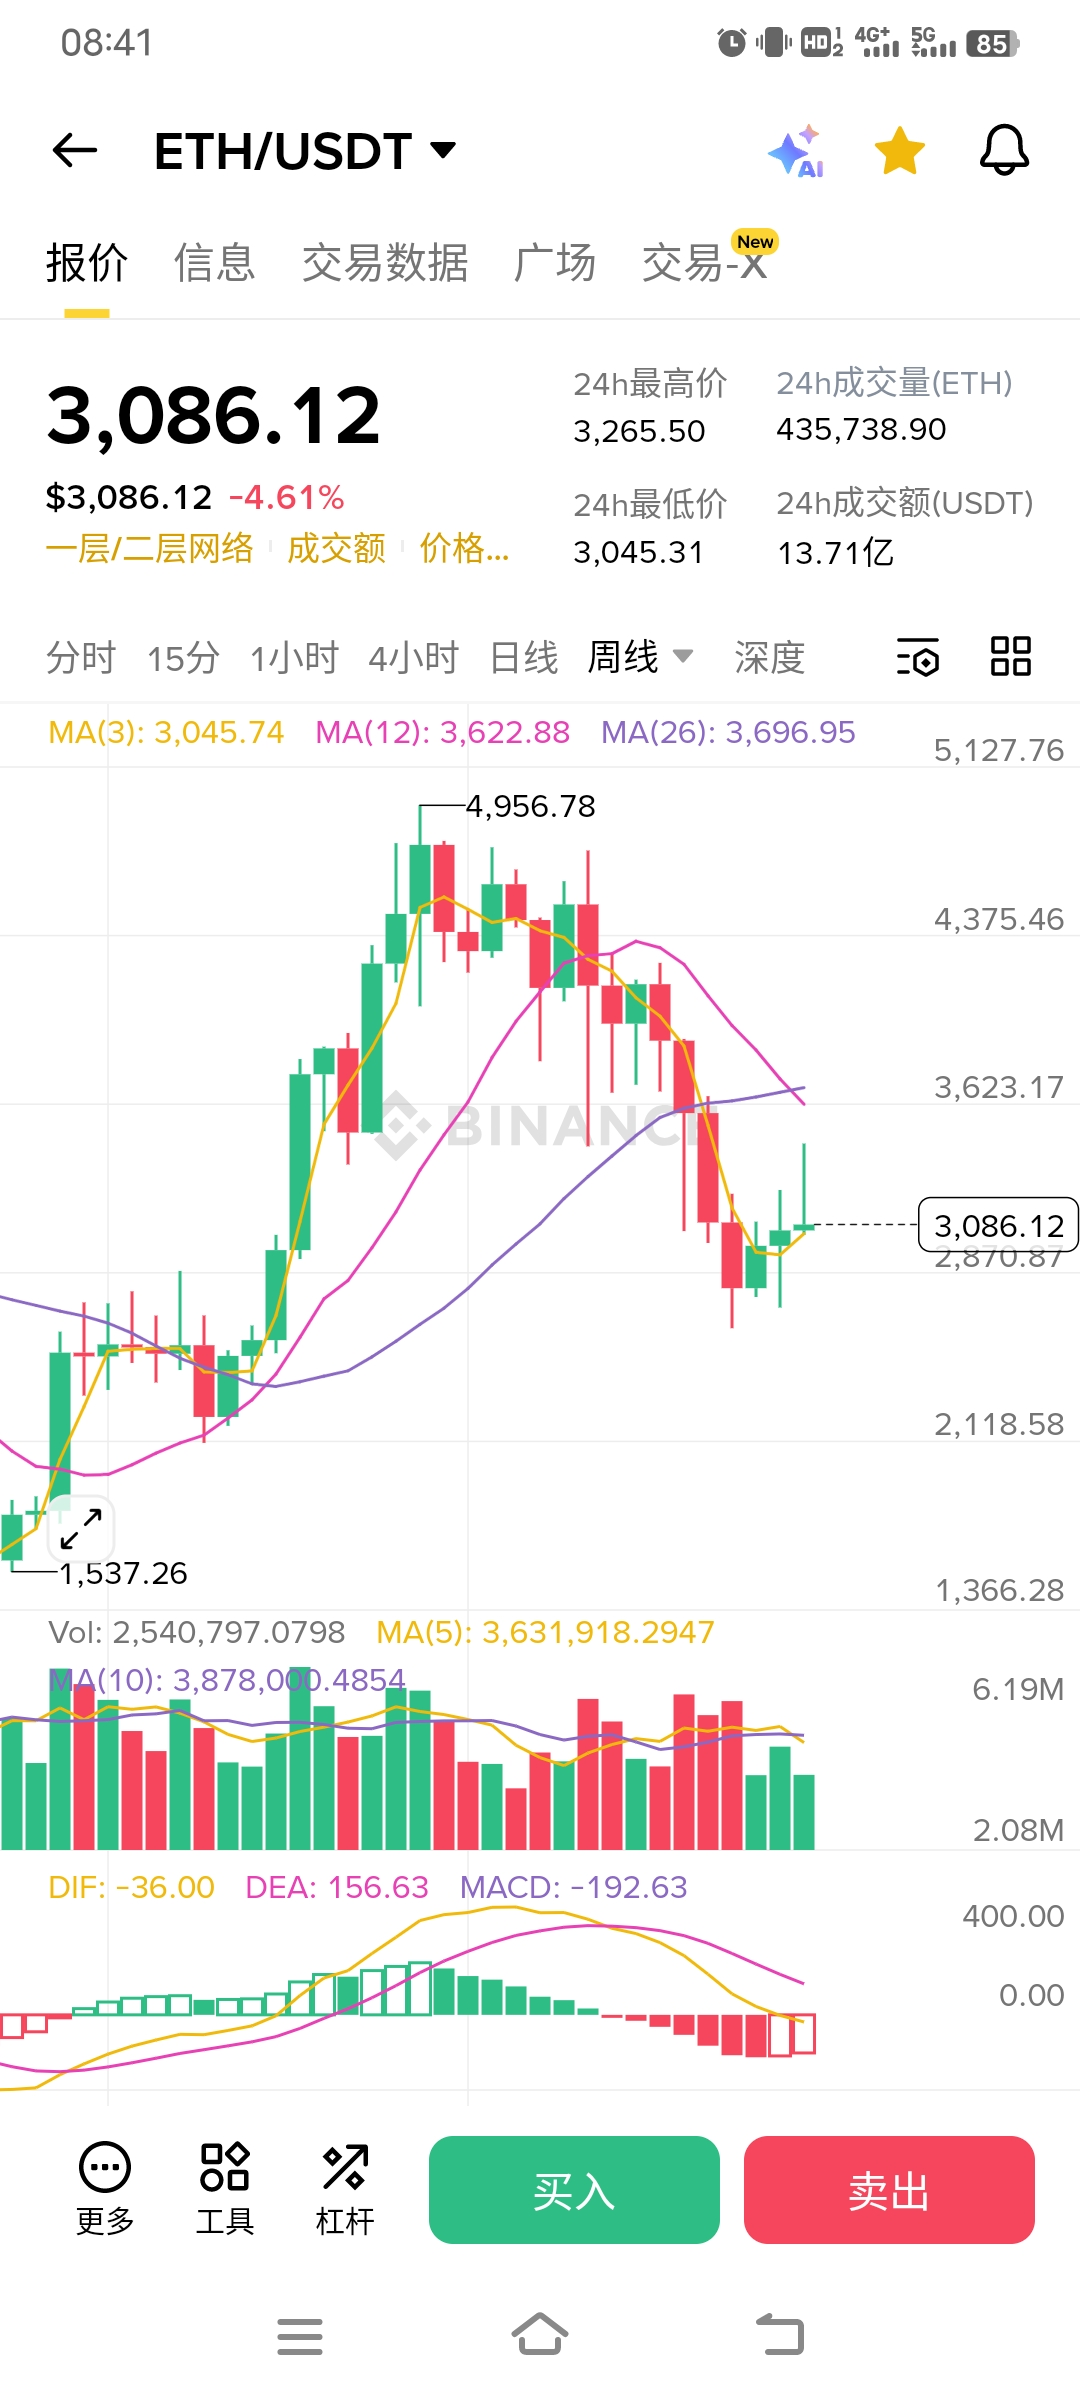
3. The weekly and monthly charts have crashed: The trend is the father; those who follow the trend will prosper!
Broaden your perspective to see the larger cycle, it can directly scare you:
Weekly chart: MACD histogram -194! This is a terrifying figure from the 2022 bear market! RSI has dropped to 33, and the downward momentum is fiercer than Maotai's stock split.
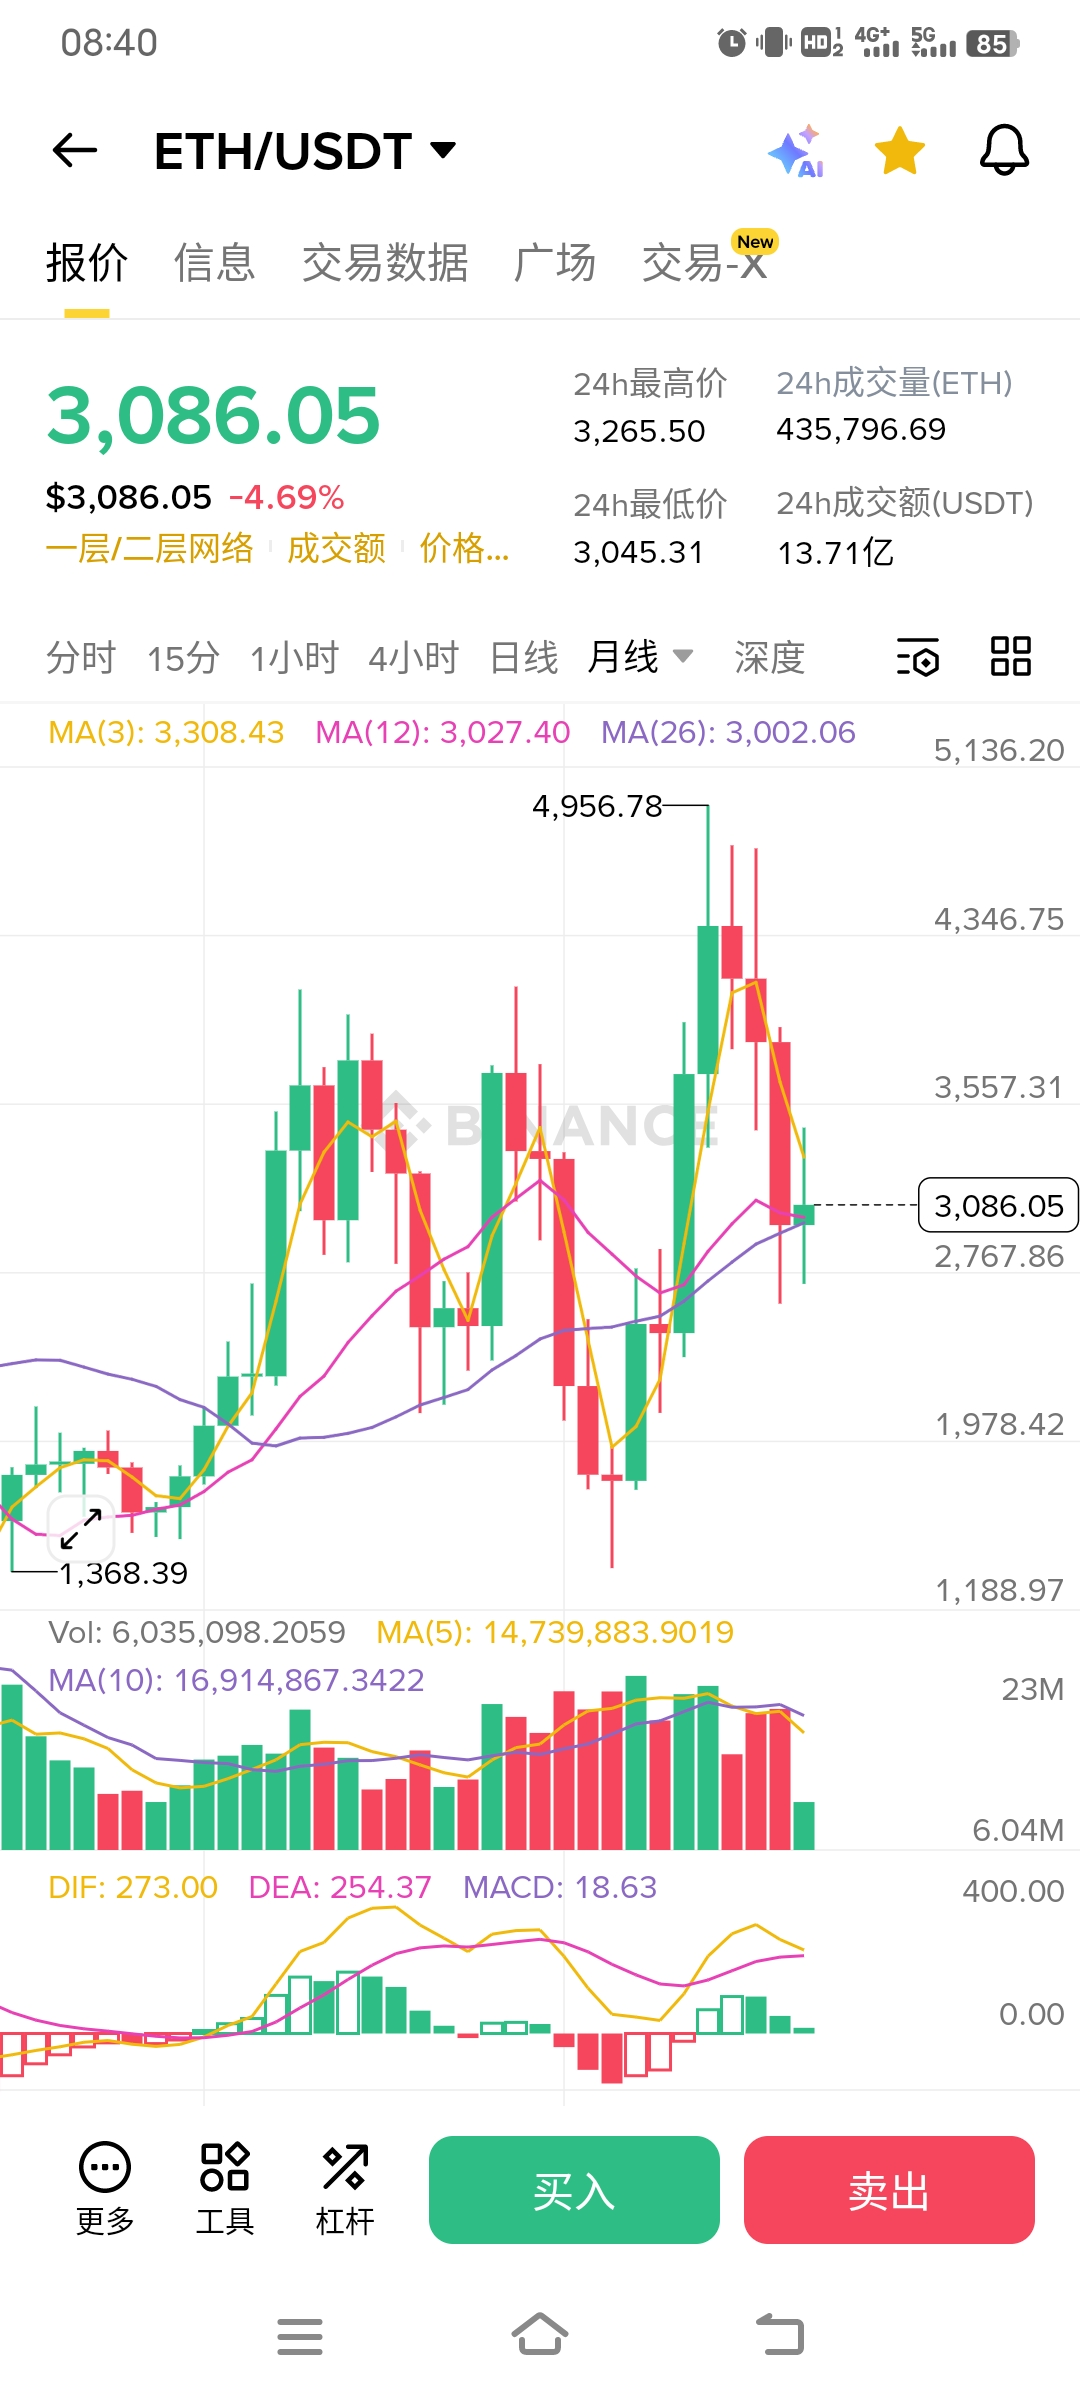
Monthly chart: Long-term moving averages are a mess, the downward channel has officially begun! This is not a correction, it’s a complete switch between bulls and bears!
Heart-wrenching truth: The weekly chart shows a strategic decline, and the monthly chart shows a directional breakdown! Entering the market now is like flying a kite in a typhoon; the line breaks, and people perish!
4. Survival guide for veterans: Three do nots, three must waits!
Bloody strategy:
1️⃣ Heavy position: A rebound is an opportunity to flee! 3050 is the first hurdle, 3100 is the death line, if it passes, hurry and escape!
2️⃣ Light position: Control your hands! This is not the time for a full bet, wait for the weekly MACD to shrink before acting (expect another 10% drop)
3️⃣ Empty position: Congratulations! Remember the mantra—better to miss than to make a mistake!
Entry signal (remember!):
Daily chart stabilizes above MA7 + MA25 dual moving averages
Weekly chart shows a long lower shadow (like a hammer hitting the ground)
Trading volume increases by more than 2 times
Ultimate advice:
“Making money in a bull market is luck; surviving a bear market is strength! Stay alive now, and you'll be a legend next year!”
5. Mysterious code warning: Run immediately when these signals appear!
🔴 ETH drops below $3000: directly triggers panic selling
🔴 Giant whale addresses collectively sell off (like when Vitalik suddenly dumps)
🔴 Federal Reserve raises interest rates (don't ask, just know it's a black swan)
Remember: The market specializes in punishing all kinds of disobedience! Playing dead is ten times better than blindly flailing around!
💡 Let me say something heartfelt:
“The fate of retail investors is self-inflicted! Those who bought the dip in 2022 are doing it again in 2024. This time, think more—trends haven't changed, but positions need to!”#加密市场观察 #ETH走势分析 #亚洲家族办公室加密资产配置 #美联储降息


