Dogecoin has now reached a very critical stage, with prices being tightly compressed within a symmetrical triangle, getting narrower and narrower, while almost aligning with the Wyckoff structure on a larger cycle.
The lows are getting higher in waves, the structure is constantly tightening, and with some Wyckoff signals slowly emerging, it indicates one issue — the strength of DOGE is quietly accumulating, likely preparing for a big move.
The multi-timeframe range strategy can be summarized in one sentence: go long at low points, go short at high points.

The focus is only one: find long positions in severely undervalued locations and short positions in obviously overvalued locations. As long as there's an MTF range, the upper and lower edges of the range will basically show the Wyckoff structure, and the signals given by the market will be very clear, with more concentrated attention.
Currently, Dogecoin is in an extremely undervalued zone across multiple time frames and has established an 8-hour pivot point. In trading pivots, the key is not the first two candlesticks, but whether the third candlestick can provide strength confirmation, which is the SOS signal.
Bitcoin also experienced a similar 8-hour pivot point recently, but due to the significant deviation in the range, actual operational difficulty was higher. Because of this, although Dogecoin's current structure looks more appealing, executing a trade is not easy at all.
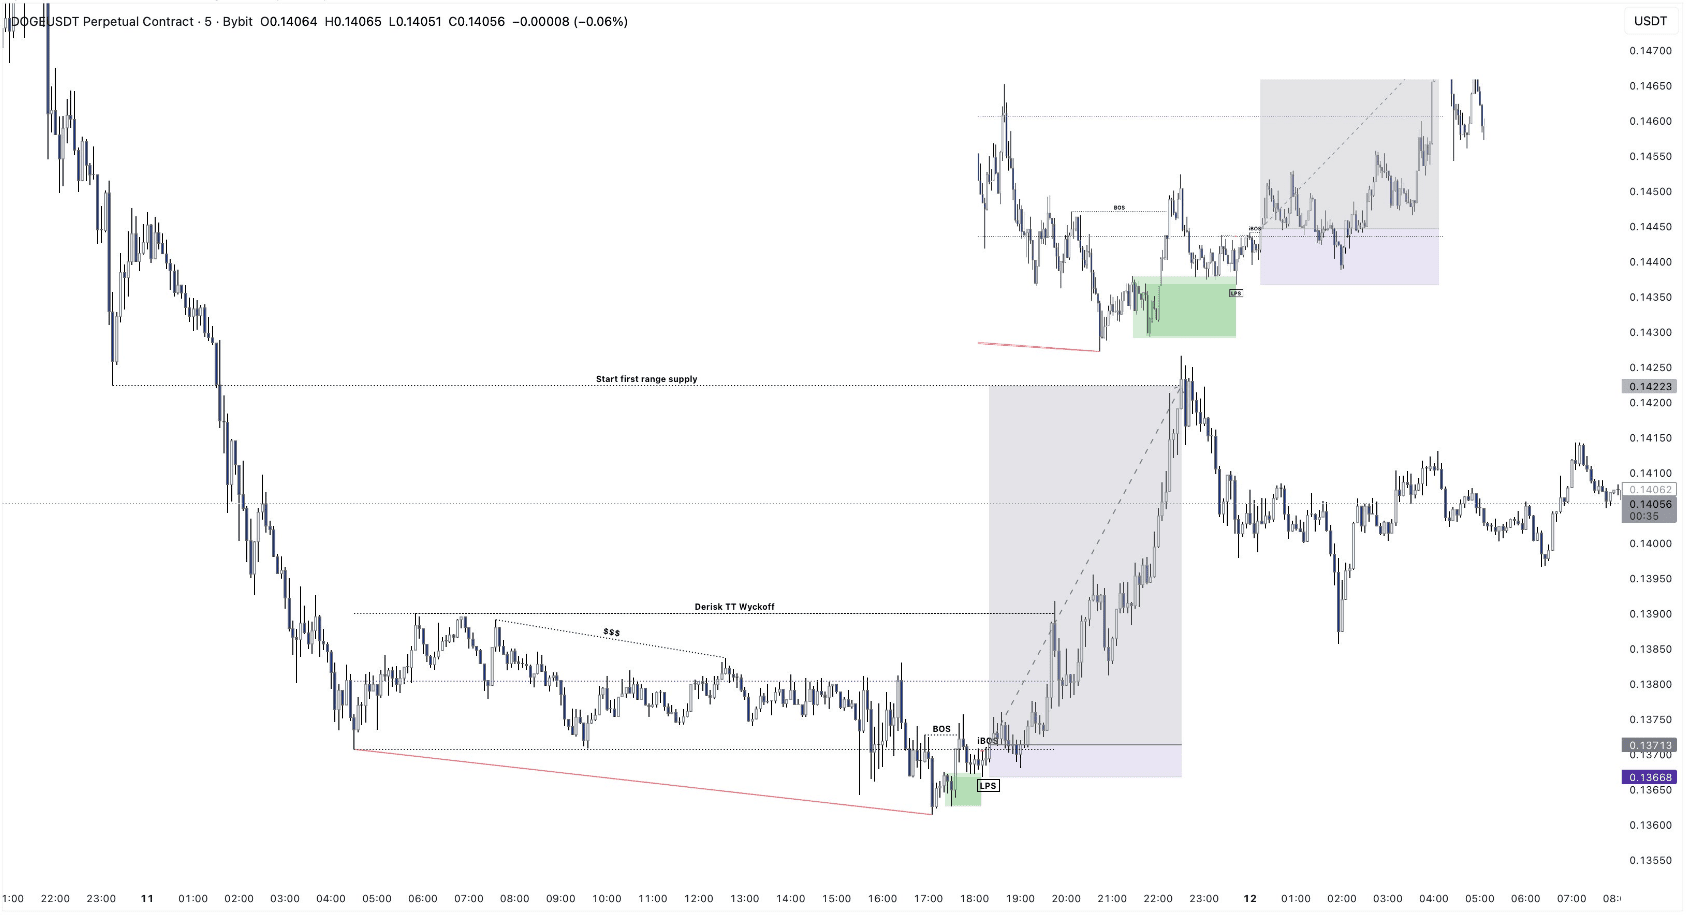
Looking at smaller time frames, Dogecoin has also exhibited the range oscillation structure of Wyckoff Model 1. When the third candlestick opens and the price moves downward, it’s crucial to focus on signals like LPS, BOS, and internal BOS.
There are two relatively safer entry methods: one is to enter directly after a BOS breakout at the 3-minute level, placing the stop loss below the M1 low; the other is to wait for the internal BOS to appear, entering at the LPS position, with the stop loss set below the LPS.
Risk control for each trade should be kept within 2%. TP1 is set at the Wyckoff target zone, taking 40% profit first; TP2 looks at the supply level of the first range, and once fatigue signals (SOW) appear, exit immediately.
The advantage of this approach is its clear logic and well-defined structure, allowing for a more disciplined response to DOGE's multi-level movements dominated by the Wyckoff structure.
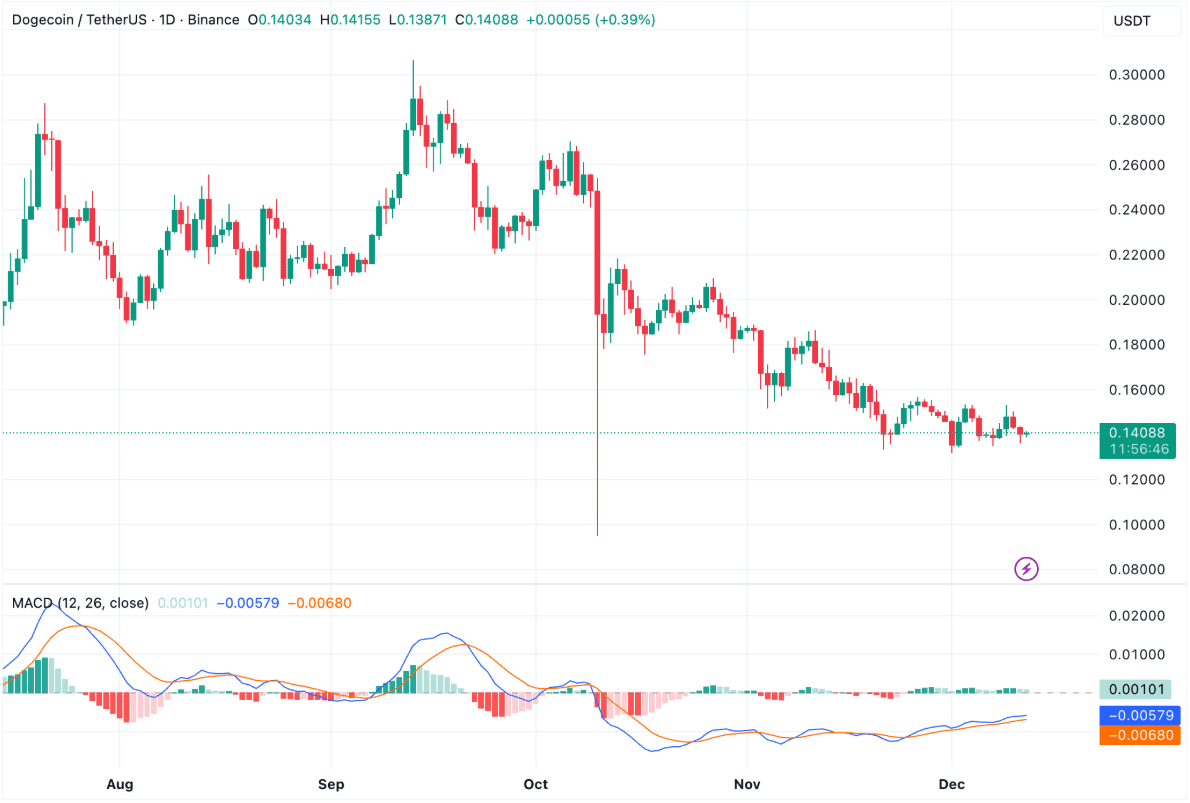
From the daily structure perspective, although the overall trend is still downward, the movement is not weak and is quite resilient.
Although the overall direction remains downward in recent times, the daily chart clearly shows that Dogecoin is actively building a more stable structure. Comparing the current movement with previous cycles, this sense of 'strengthening at the bottom' is actually very evident.
Historically, when the overall market weakens, Dogecoin typically makes new lows before hitting even lower points, continuously reinforcing the downtrend. However, this time is clearly different; DOGE has not moved straight down but is attempting to create higher lows within a symmetrical triangle.
This structure is very critical. The emergence of a symmetrical triangle often indicates that Dogecoin has stopped its continued decline. This usually suggests that selling pressure is weakening, and the market is preparing for a possible directional breakout.

