50 essential things to know before you enter the crypto world: learn them to avoid losses before you start making money!
The cryptocurrency world is not a casino, it's a battlefield!
Some people become rich overnight, while others lose everything, simply because some people enter the market with their brains, while others run naked with greed!
Many people rush into the cryptocurrency world hoping to get rich overnight, but they don't even understand some basic concepts. They can't understand on-chain data, can't read candlestick charts, and don't know how market makers fleece investors. They deserve to be the ones left holding the bag by project teams.
Today, Egg Tart has summarized 50 essential introductory tips for beginners. Learn these first to avoid losses, then think about making money. Once you lose your principal, the cryptocurrency world is over for you.
[Basic Concepts]
1. What is blockchain? It is a decentralized ledger where transaction records are publicly available across the entire network. To modify data, you would first need to hack 51% of the computers on the network.
2. Public blockchain/private blockchain/consortium blockchain: Public blockchains (such as BTC and ETH) can be used by anyone, private blockchains (such as those within a company) require permissions, and consortium blockchains (such as Ripple) are small circles of a few institutions.
3. Token and Coin: Coin is "currency" (such as BTC), and Token is "points" (such as UNI from UNISWAP). Don't be fooled by the project team.
4. What is DeFi: Decentralized Finance, using code to replace banks, enabling lending and wealth management, but what if the code has vulnerabilities? Then the money is gone.
5. NFTs are not JPGs: They are digital proof of ownership, but don't touch "air NFTs." Before buying, ask yourself: Who can I sell this to?
[Trading Techniques]
6. Spot vs. Futures: Spot trading is like "buying cabbage," while futures trading is like "leveraging to gamble on cabbage prices." Beginners should start with spot trading.
7. Must-read candlestick charts: bullish candlesticks (up), bearish candlesticks (down), and moving averages (average cost lines). Don't be blinded by the "red and green" colors.
8. Support/Resistance Levels: When prices fall to a certain point and then rebound, it is called support; when prices rise to a certain point and then fall back, it is called resistance. This is a "psychological warfare" tactic.
9. Trading volume: A rise in volume may indicate a fall, while a fall in volume may indicate a rise, but don't memorize it rigidly; combine it with the trend.
10. Stop loss and take profit: Exit when you reach your expected profit, and cut your losses when the price hits your stop loss line, such as 10%. Don't be greedy. The crypto world is never short of "opportunities".
[Risk Prevention and Control]
11. Private key = lifeline: If you lose your private key, you lose your coins. Don't store it on cloud storage, don't take screenshots, use a hardware wallet.
12. Confirm withdrawals: When withdrawing funds from an exchange to your wallet, first transfer 0.0001 coins to test the transaction, and then transfer larger amounts only after confirming receipt.
13. Stay away from "Dog" coins: 99% of coins with names containing "Dog," "Shib," or "Floki" are "air coins" (coins with no real value). Don't be a sucker.
14. Beware of "teachers": Anyone who tells you to "buy the dip" or "sell the top" is either a scammer or a fool. There are no "stock market gurus" in the cryptocurrency world.
15. Don't use leverage: 10x leverage means a 10% drop will wipe out your account. Don't gamble your entire fortune on tomorrow.
[Ecological Understanding]
16. Bitcoin is “digital gold”: with a total supply of 21 million coins, it is an inflation hedge and the eternal anchor of the cryptocurrency world.
17. Ethereum is an "operating system": DeFi, NFTs, and games all run on it, but the gas fees are a bit high and the concurrency rate is a bit low.
18. Layer 2 is the "highway": it solves Ethereum congestion, such as Arbitrum and Optimism, with low transaction fees and fast speed.
19. Cross-chain bridge = "portal": Transfer coins from Ethereum to BNB Chain using a cross-chain bridge, but avoid using small platforms, as they are easily hacked.
20. Stablecoins = “Digital Dollars”: USDT, USDC, DAI, pegged 1:1 to the US dollar, but USDT has the risk of over-issuance.
[Project Analysis Section]
21. Must-read white papers: What does the project do, how does it make money, and who is on the team? Don't trust the "Chinese white paper," read the original English version.
22. Token economic model: Total supply, how it is allocated, whether there is a "lock-up" mechanism, and avoid buying coins with "unlimited issuance".
23. On-chain data: Look at "number of holding addresses", "transaction volume" and "large transfers". Data doesn't lie, but it can be manipulated.
24. Community popularity: Twitter followers, Telegram group activity, but don't believe "market recommendations", look at "real discussions".
25. Competitor Comparison: Which is more secure, Aave or Compound, both offering lending services? Which is faster, Solana or Avalanche, both public blockchains?
[Tools Section]
26. Exchanges: Binance, EY, Coinbase. Beginners should start with "spot trading" and avoid "contract trading" and "leverage".
27. Wallet: MetaMask, TP Wallet. Keep your private key safe and don't store it on exchanges.
28. Market data software: CoinGecko, CoinMarketCap, to view rankings, market capitalization, and trading volume.
29. On-chain explorers: Etherscan, BscScan, to check transaction records and token holding addresses.
30. Information platforms: CoinDesk, The Block. Don't be swayed by clickbait headlines; look for in-depth analysis.
[Mindset]
31. Don't FOMO: If you see a coin going up, don't rush to chase it; it might be a pump and dump.
32. Avoid FUD: Don't rush to sell when you hear bad news; it might be a market correction.
33. Don't go all in: Invest only with spare cash; don't sell your house or borrow money to speculate on cryptocurrency.
34. Long-termism: BTC has increased 10 million times in ten years, but 99% of people can't hold on to it because of frequent trading.
35. Learn to rest: Don't be greedy in a bull market, don't panic in a bear market. The crypto market trades 24 hours a day, but your heart can't.
[Advanced Section]
36. Staking Mining: Deposit your coins into a DeFi platform to earn interest, but be aware of "impermanent loss".
37. Liquidity mining: Earn transaction fees by providing liquidity to trading pools, but avoid high-yield options, as they may be Ponzi schemes.
38. How to play with NFTs: Buy blue-chip projects (such as BAYC and CryptoPunks), and don't buy junk NFTs.
39. GameFi: Earn money while playing games, but pay attention to the economic model and avoid Ponzi schemes.
40. DAO: Decentralized Autonomous Organization, which makes decisions by voting with tokens, but avoid participating in "small DAOs" as they are easily manipulated.
[Slang Section]
41. “Showdown”: All in, a gambler's behavior.
42. "Airdrop": Get free coins, but don't believe in "prepaid airdrops", it's a scam.
43. “Rug pull”: The project team runs away with the money, and the price of the token drops to zero.
44. "Whale": Addresses holding a large amount of cryptocurrency, whose every move affects the price of the cryptocurrency.
45. “Washout”: The main players deliberately drive down the price to scare away retail investors.
[History Section]
46. The 312 crash: On March 12, 2020, BTC dropped by 50% in one day. How many people were liquidated?
47. The 519 Massacre: On May 19, 2021, the cryptocurrency market experienced a collective crash, with DeFi's total value locked (TVL) halved.
48. Luna Crash: In 2022, the algorithmic stablecoin Luna went to zero, wiping out $40 billion.
49. FTX Collapse: In 2022, FTX, the world's second-largest exchange, went bankrupt, and its founder SBF was arrested.
50. Bitcoin Halving: The production is halved every four years. Historically, the price drops before the halving and rises afterward, but don't stick to this outdated approach.
"These 50 key points are my experience climbing out of the 'sea of corpses' in the cryptocurrency world. Bookmark this article and you can avoid three years of detours!"
Here's another piece of advice: The cryptocurrency world isn't a money-printing machine, it's a tool for monetizing knowledge. Every penny you earn reflects your understanding of the world.
Then you'll learn to use some basic cryptocurrency tools, and that's it!
There are so many cryptocurrencies in the crypto world, you need to understand clearly which one to buy and how to buy it.
Otherwise, relying on gut feeling to trade cryptocurrencies is ultimately not a sustainable strategy. This article introduces several cryptocurrency trading software programs that I frequently use, hoping to be of greater help to everyone.
Note: I cannot provide links to the websites I introduce below. You can search for them on Google if you need them.
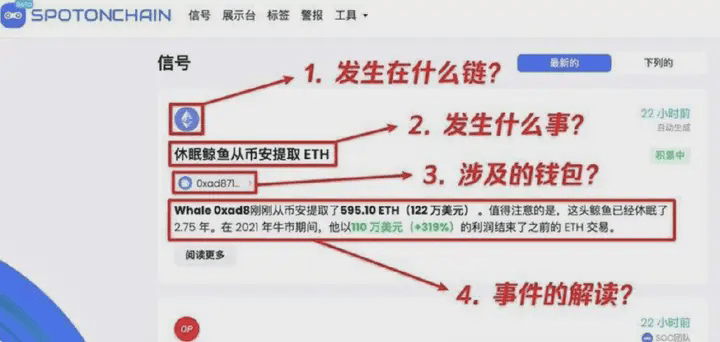
1.SpotOnChain
The cryptocurrency world isn't just about buying coins on exchanges. There are many coins that aren't available on exchanges, and some whales will also transfer their purchased coins to the blockchain.
Therefore, using some on-chain analytics tools can help investors see more information.
This is an on-chain data analysis platform with functions including but not limited to: on-chain information broadcasting, address relationship visualization, address monitoring alerts, etc.
On this platform, you can monitor the addresses of organizations, smart money accounts, and some influential figures, etc.
Its database tags hundreds of influential people, investment funds, and CEXs.
This website contains detailed information about transactions involving venture capital firms or other well-known cryptocurrency entities when transferring large sums of money.
2.Arkm
Arkm is also an on-chain analytics software, and I prefer it to SpotOnChain. It has more comprehensive functions, including alerts, tracking, and viewing buy and sell information from various addresses. However, it's unfortunate that Arkm cannot track data on the Sol chain.
3.Crypto Deal Flow
In the cryptocurrency space, the more funding a project raises, the more institutions and funds are optimistic about it, and the greater its potential for future growth.
Therefore, before buying a cryptocurrency, you can check its funding information. This website allows you to check the funding history of different projects, but it's more suitable for those who are proficient in English.
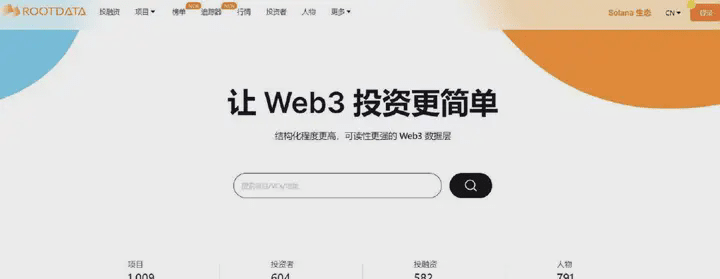
For those who aren't fluent in English, you can check out Rootdata, which is more suitable for Chinese users.
Rootdata is generally quite good. One drawback is that it allows users to create their own information, which means the information may be inaccurate. Users should judge for themselves.
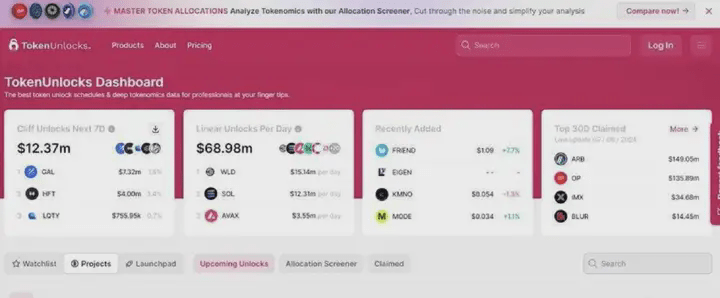
 (4)Token Unlocks
This website mainly focuses on token unlocking, and many mainstream tokens have relevant unlocking information on it.
Unfortunately, free users can only view a very limited amount of data, specifically 7 days' worth.
Aside from large-scale token unlocks, the unlocking of a typical number of tokens usually begins to generate buzz within the community about a month before the unlock, so if you want to check it out as early as possible, you can only do so by becoming a member.
However, many Chinese-language media outlets compile information on the monthly token unlocking at the beginning of the month, so sometimes paying attention to these media outlets is sufficient.
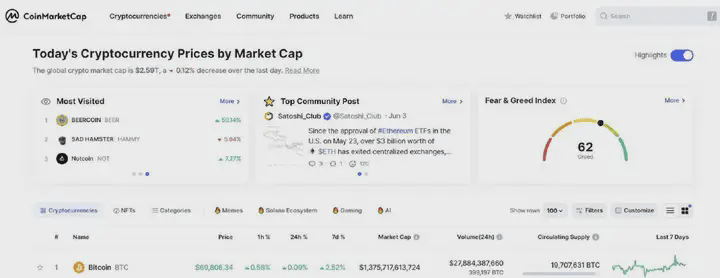
 (5) Coinmarketcap
Simply put, CMC is a software for checking cryptocurrency prices.
The data includes information on most mainstream cryptocurrencies, including price, circulating supply, FDV, and more.
Furthermore, the website has listed a section for tokens, allowing users to find token-related information based on this section.
 (5)Dex Screener
Dex Screener is also a website for viewing token prices and candlestick charts, among other information.
However, this website generally doesn't show mainstream cryptocurrencies, but rather low-market-cap cryptocurrencies and memes.
This website is basically a must-have for those looking to become a "Turkish dog" (a derogatory term for someone who is obsessed with farming).
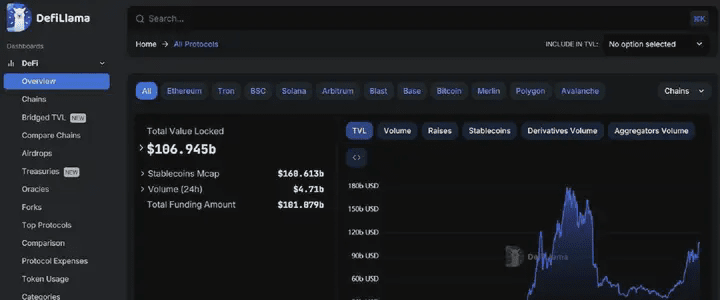
(6) Defillama
DefiLlama is a Web3 tool that allows users to view data on DeFi, stablecoins, NFTs, and more.
I won't go into too much detail, but in short, both retail and institutional investors frequently use DefiLlama to view data and help them make investment decisions.
Here you can view the TVL of each chain and project, as well as other more detailed on-chain data, to make informed investment decisions.
 Have you ever thought about this question: who is really reaping your time?
According to data from QuestMobile, an authoritative research institution, young people today spend an average of 2.8 hours a day watching short videos, which amounts to about 1022 hours a year; they unconsciously scroll through their WeChat Moments during their daily commute, accumulating about 456 hours a year; and they spend about 300 hours a year browsing shopping websites during their lunch break...
This shows that the one who truly steals your time is not someone else, but yourself who is completely unaware of it!
These fragmented moments are enough to transform a novice into a professional trader within 3 years, like Xiao Jia, one of our students who earned 100,000 yuan a month, whom I shared with you last year.
II. Choice is more important than effort
Imagine two people: Zhang San, an ordinary working man, who spends an hour scrolling through Douyin (TikTok), reading fantasy novels for 40 minutes, and playing three rounds of Honor of Kings every evening after getting off work at 7 pm; and Li Si, a cognitively awakened individual, who spends an hour reviewing candlestick charts, listening to audiobooks by trading masters for 40 minutes, and writing trading logs every evening after getting off work at 7 pm.
Guess what changes will happen to Zhang San and Li Si's lives two years from now? Let me tell you! Two years later, Zhang San will reach the King 50 star rank in King of Glory, weigh 180 pounds, and then spend 60,000 yuan to participate in "stock trading master" copy trading and get wiped out. Meanwhile, Li Si will most likely have a stable and profitable trading system that outperforms the CSI 300 Index, and his side hustle income will easily far exceed his main job!
Don't think I'm talking nonsense. Our student Liangliang (pseudonym) used his commute time to review the previous day's K-line chart and his lunch break to test quantitative models. In 2024, he earned 137% of his annual salary through gold swing trading!
If you really want to make money in the trading market in less than a year, just like him, then I will share my own growth process and the successful practice methods I have summarized from the past 10-plus training camps with you without reservation.
III. Phase 1: Understanding the Market
The first stage is understanding the market. This stage requires you to learn three things in one month:
The first thing: K-line chart.
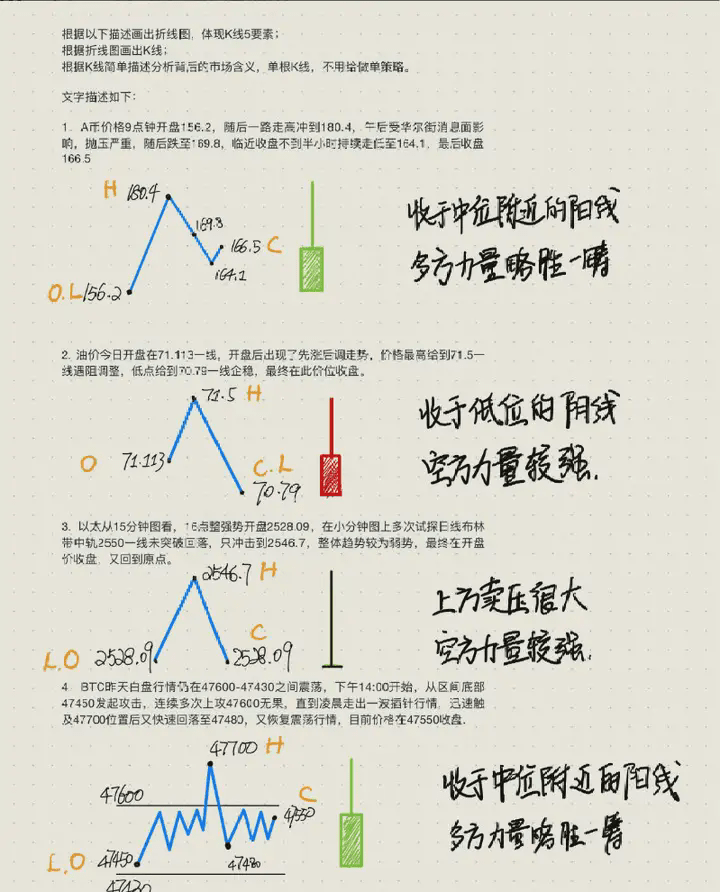 (Figure 1: (Basic) Assignment No. 3 - Basic K-line Assessment)
When a chart is placed in front of you, you should at least be able to understand candlestick charts, right? It can't be that "it recognizes you, but you don't recognize it." Candlestick charts are just a visual representation of the patterns of market price fluctuations, but it's definitely not enough to just look at the high and low opening prices of a candlestick chart. You also need to understand the underlying line-like fluctuations.
In short, you need to learn how to interpret the lines behind each candlestick. (See Figure 1)
 (Figure 2: (Naked K-line) Assignment No. 2 - Basic Assignment on Price Behavior)
Furthermore, you need to be able to distinguish whether each candlestick represents an uptrend, a downtrend, or a non-trend candlestick (as shown in Figure 2).
Trend candlesticks: These generally refer to candlesticks that successfully break out (which could be a breakout of a range, a structure, or even the extreme point of the previous candlestick), representing the initiation or continuation of a trend. They are a strong symbol of a trend and allow you to identify at a glance whether the market is dominated by bulls or bears.
Non-trend candlesticks: Simply put, these are candlesticks that don't allow you to immediately determine whether the market is dominated by bulls or bears. These candlesticks indicate that the market is temporarily directionless, in a state of stalemate between bulls and bears, and is back to choosing a direction. Think carefully: haven't you impulsively entered the market and suffered losses many times because you saw non-trend candlesticks?
The second item: 12 K-lines and signal K-lines, entry K-lines.
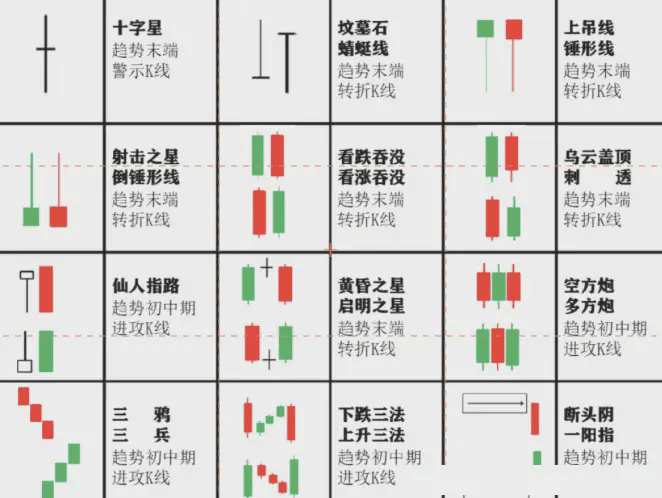 (Figure 3: Horizontal 12K Gold Wallpaper)
What are 12 Golden Ks? They are 12 K-line combinations that I have summarized to help you make money in the market. If you don't have the high-definition 12 Golden Ks chart shown on the screen yet, please contact the assistant through the official WeChat account to get it for free (as shown in Figure 3).
What are signal candlesticks? Simply put, they are candlesticks that signal you to sharpen your knives and prepare to enter the market; they are the moment you crouch down when you see the starter raise the starting gun. The reversal candlesticks in the 12 Golden Candlesticks are the simplest and most common signal candlesticks that I have compiled.
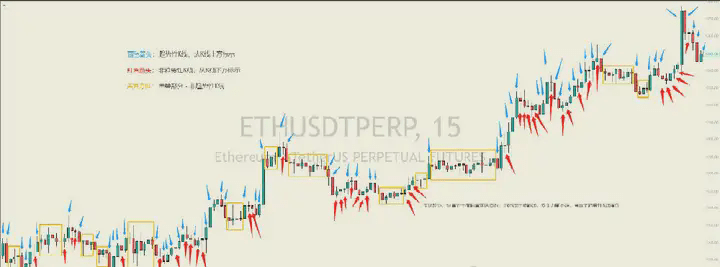
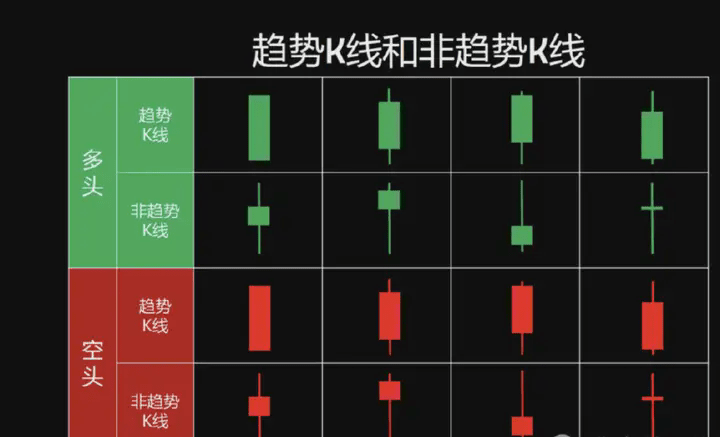 (Figure 4: Bullish trend candlestick chart & bearish trend candlestick chart & valid entry candlestick chart)
What is an entry candlestick pattern? It's the candlestick pattern that truly makes you decide whether to place an order and go all in. It's the action you take the moment when you hear the starter pull the trigger or hear the gunshot—you take off running. Signal candlesticks are for preparation; entry candlesticks are for execution. (See Figure 4)
The third thing: basic candlestick patterns and structures.
When we open the chart, besides the additional indicators we've added (generally referring to moving averages, trading volume, indicators, etc.), all that's left is the candlestick chart, but don't forget...
We need to know what the market is currently doing before we enter the market.
Is there a trend or not?
Will it go up or down?
Is it the end or the beginning of an upward trend?
Which trend should I follow?
How should I intervene in this situation?
Which trend reversal should I target?
Where should I lie in ambush and wait for an opportunity?
Obviously, those two small skills alone are not enough to solve these problems, so we must apply the knowledge we have learned about market structure, patterns, etc., to the market.
 (Figure 5: Intensive training camp deliberate practice: all price behavior patterns)
 (Figure 6: Intensive training camp deliberate practice: all price behavior patterns)
Taking price action as an example: You need to quickly identify the components we learned in (06-Naked Candlestick Chart) such as bull flags, bear flags, terminal flags, simple retracements, complex retracements, trading ranges, FB structures, SB structures, etc. (See Figures 5 and 6).
Furthermore, we need to know which segment of the simple pullback we are currently observing is correct, and what level of the complex pullback we are observing is correct. How do we measure the distance? How do we determine the starting point of an upward or downward trend?
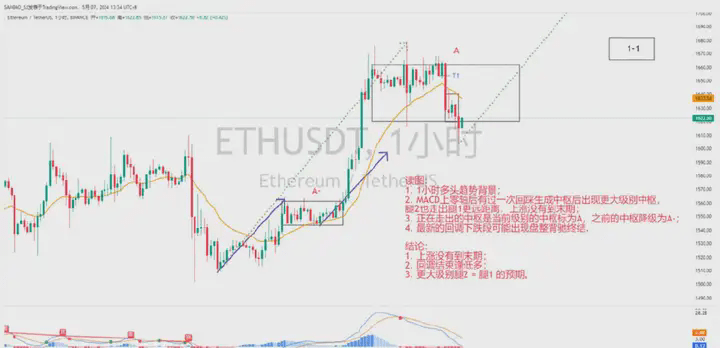
 (Figure 7: Intensive training camp deliberate practice: trend types in the theory of fractal geometry)
Taking the theory of fractal geometry as an example: you need to quickly identify the components we learned in (13-Panda's Explanation of Fractal Geometry) such as the center, trend type, associative law, termination method, center level, and whether the market has ended yet, etc. (as shown in Figure 7).
This allows us to determine which trend is closest to us, what its trend type is, how the previous trend type ended, and whether the current incomplete trend type is worth following.
This is somewhat like building a house. We need to ensure that our individual skills are up to par, such as mixing cement, laying bricks, drawing blueprints, and tying steel bars. These are called individual skills. Only then can we think about how to build a wall, construct a room, or construct a house.
Okay, up to now, we've almost finished the first stage of achieving stable profits: understanding the market. Next, let's talk about the second stage of achieving stable profits: deliberate practice.
IV. Phase 2: Deliberate Practice
Deliberate practice means transforming the knowledge we learn in the first stage into our skills. Just like you will never learn to swim if you only study how to breathe and take a breath on land!
Step 1: Reading the picture
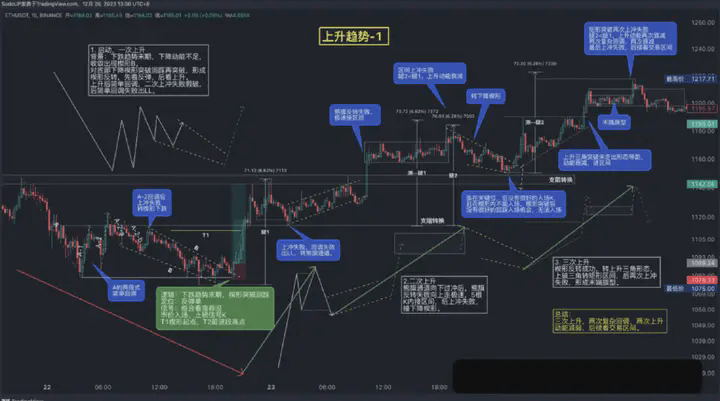
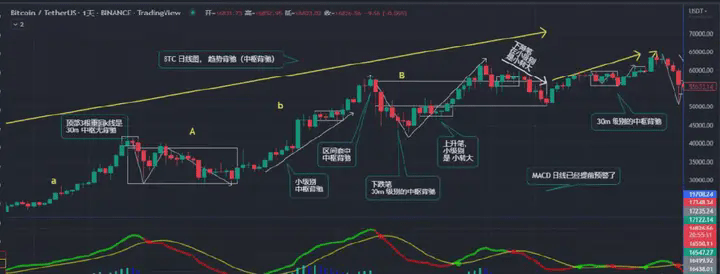
 (Figure 8: Intensive training camp deliberate practice: interpreting charts using the theory of fractal geometry and trend types)
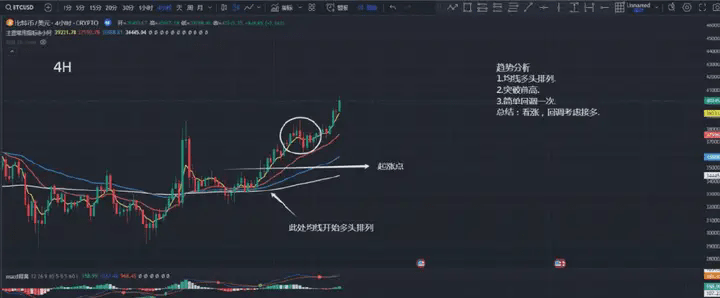 (Figure 9: Intensive training camp practice using price behavior to interpret charts)
Let's start with the first small step of deliberate practice: chart reading! Chart reading refers to chart analysis.
You need to know what the market in front of you is currently doing.
Is there a trend or not? Is it rising or falling? Is it in the late stages or early stages of an uptrend? Which trend should I follow? How should I enter this trend? Which trend reversal should I trade? Where should I position myself and wait for the opportunity?
In stage 1, we learned three things, right? Now, can you try to connect those three things in your mind to draw a conclusion and answer the question above? (See Figures 8 and 9)
Step 2: Identify all trading opportunities on the chart.
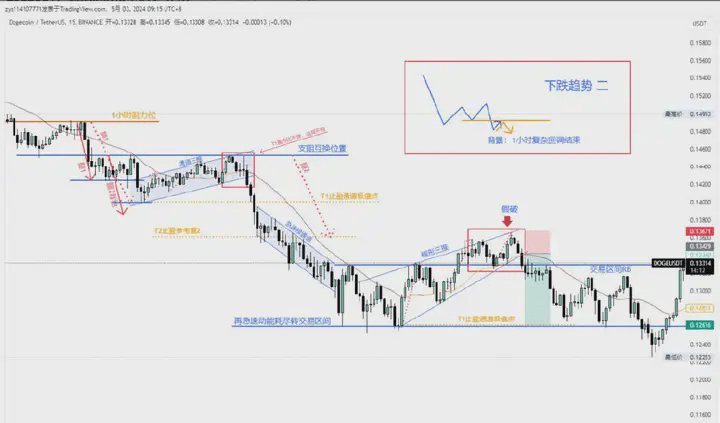
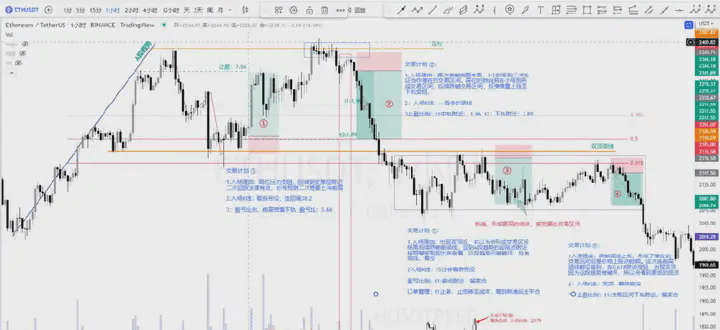 (Figure 10: Deliberate practice in the special training camp: finding all opportunities)
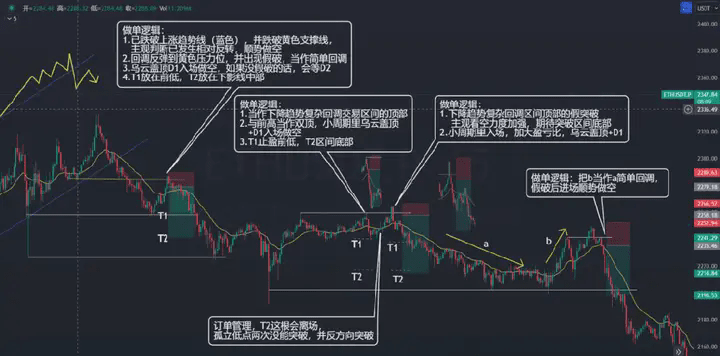 (Figure 11: Deliberate practice in the training camp: Find all opportunities)
Next, the second step: Identify all the trading opportunities on the chart.
You now have the basic skill of analyzing market movements and drawing conclusions by connecting the knowledge points in your mind. Your second step is simple: try to identify all the entry opportunities you can find, from a hindsight perspective—the more, the better. (See Figures 10 and 11)
For example, if a rising wedge pattern appears at the beginning of a downtrend, I would enter a short position when a low 1 or low 2 appears at the top of the rising wedge, and mark it on the chart.
For example, if you see an FB structure in a downtrend that is not yet in its final stage, then mark this trading opportunity on the chart.
For example, at the beginning of an upward trend, one might look for a high of 1 or 2 at the bottom of a sideways trading range to enter a long position and mark it on the chart.
Step 3: Try to identify your favorite and best-performing trading type.
When you've done enough deliberate practice in step 2 (identifying all trading opportunities), say 50, 100, or 200 trades, the answers to the following questions will automatically come to mind:
"It seems I prefer to do reversals in the xxx pattern."
"It seems I prefer doing this kind of pattern reversal."
"It seems that in certain situations, seeing a higher rank (2) increases the win rate compared to seeing a higher rank (1)."
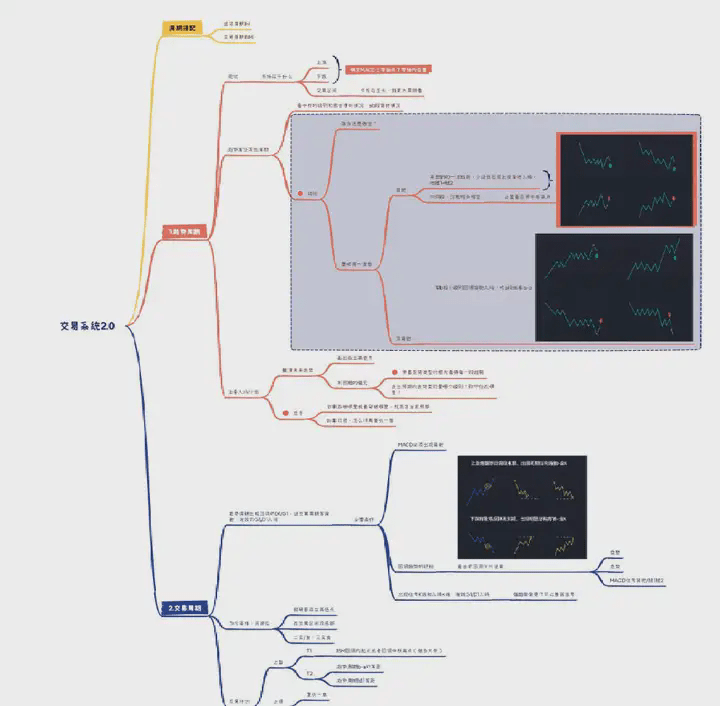
 (Figure 12: Intensive training camp deliberate practice: writing your own trading system & basic win rate)
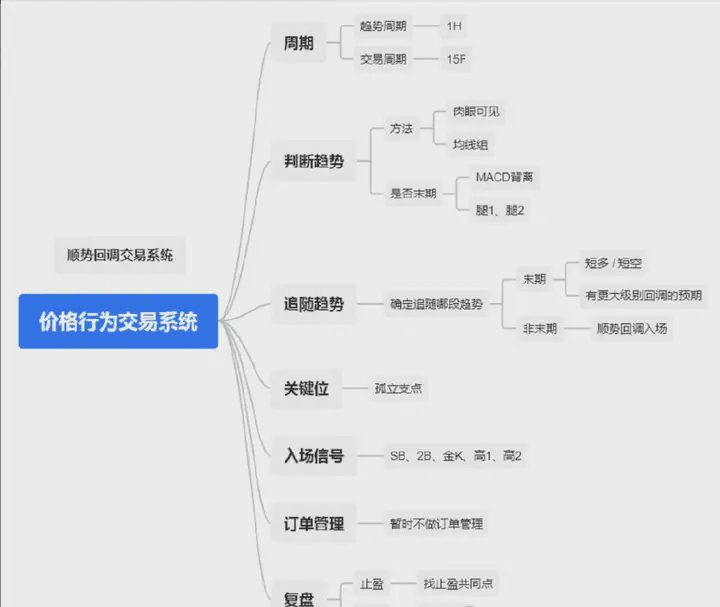
 (Figure 13: Intensive training camp deliberate practice: writing your own trading system & basic win rate)
Yes! Excellent, that's it, that's it. We'll try to write down these patterns, and gradually, gradually, your first trading system will emerge. It may look a bit simple, even rudimentary, but that's okay! It's the result of your countless days and nights of hard work, the result of reviewing each trade, and you've even run the underlying data based on this system. (See Figures 12 and 13)
See, as long as you follow the correct and scientific training methods, isn't it not that difficult to have your own trading system?
Phase 3: Daring to go into the water
Okay, after the deliberate practice in the second stage, and after you have continuously refined and iterated your trading system, you finally developed a trading system with a high win rate one day. Then, you can boldly jump in!
What you need to do now is simple: take out 100 yuan and trade it in real money on the instruments and timeframes you are most familiar with. There are two objectives:
1. Try to lose this 100 yuan as quickly as possible in order to deliberately practice your habitual mindset of being afraid of losing money.
2. Compare your actual performance in live trading with the data you obtained in stage 2 to see how much the difference is and how accurate the results are.
There are two requirements for doing live trading:
1. You are only allowed to trade within your trading system.
2. You only have two bullets in your gun, which means that after stopping your losses, the same entry logic can only be used for revenge once more.
Therefore, there are only two possible outcomes after you finish doing this:
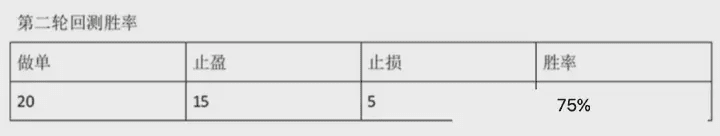
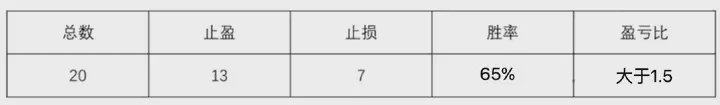
For example, the post-game data you obtain in stage 2 shows a win rate of 70% and an actual profit/loss ratio of 1.8. However, after conducting 20 or 50 live trades in stage 3, the data you obtain shows a win rate of 80% and an actual profit/loss ratio of 2.5; or a win rate of 40% and an average actual profit/loss ratio of 1.3...
In short, if the two are very different, then there must be a problem somewhere!
The most common examples include: being unable to control oneself, frequent revenge attempts, and being impulsive.
Or, to put it another way, they might not follow trading discipline and instead pursue trading opportunities outside their own system; or they might be influenced by temporary greed or noise, easily adding unverified strategies and techniques to their system; or they might simply copy their system onto unfamiliar instruments or timeframes because they have too few trading opportunities in the instruments or timeframes they are familiar with.
In summary, there are two categories: technical aspects and non-technical aspects. We will leave the non-technical aspects aside for now.
If the issue is technical, then we need to return to Phase 2, integrating the new techniques and strategies we encountered into our existing trading system, reviewing the lessons learned, and then moving on to Phase 3, iterating continuously. So you see, it's a lot like cooking. The first time you cook, there will always be some problems—it might be bland, too salty, or stick to the pan—but that's okay. We just need to learn from our experience and try again. Therefore, whether it's making braised pork or learning technical analysis, Phases 2 and 3 definitely require iterative cycles.
The second possibility is that the live trading data is very close to the post-trade data.
To be honest, the possibility is very small. Why do I say that?
Because the trading system is executed by humans, not cold, impersonal machines, it's impossible to perfectly replicate the system developed in the practice room right away. Achieving 70% replication is already quite impressive. However, if you manage to get remarkably close to the data in your very first round—like cooking a Michelin-starred meal on your very first try—congratulations, you've succeeded! You're an absolute natural talent!
Okay, up to now, I have shared my own growth process and the successful practice methods I have summarized from the past 10-plus training camps without reservation.
Hopefully this will be helpful. If your financial situation allows and your budget is sufficient, then hiring a professional coach to practice with you is certainly a good option. Because here you'll not only have professional coaches and assistant coaches, but also teammates who will share the hardships and fight alongside you through thick and thin.
The best time to plant a tree was ten years ago, the second best time is tonight after get off work. While you're waiting 30 minutes for your milk tea, someone is using their mobile MT4 app to verify the "gold price fluctuation pattern after the non-farm payroll data release"; while you're grabbing a 9.9 yuan deal with free shipping in a live stream, someone is using that time to calculate the arbitrage potential of the Bitcoin ETF premium—this isn't involution, but a bloody struggle for the pricing power of time.
In 2025, let's use candlestick charts as our brushes and price fluctuations as our ink to write our own path to financial freedom outside of the 8-hour workday.
I'm Little Egg Tart, a professional analyst and instructor, a mentor and friend on your investment journey! As an analyst, the most basic requirement is to help everyone make money. I'll help you resolve confusion, get out of trouble, and let my results speak for themselves. When you're lost and don't know what to do, follow Little Egg Tart. Little Egg Tart will guide you. #美联储FOMC会议 $BTC

