Old friends in the crypto circle, I am A Ping. Two days ago, I said not to rush to bottom fish, and today I see that $ETH really bounced from 3050 to 3120. Do you think I've slapped my face? When you see this small bullish candle, does hope for the 'return of the bull market' ignite in your heart again?
Don't rush, first splash some cold water. If you're getting excited and thinking about 'going long' because of this $70 rebound, you're likely walking step by step into the 'escape route' that the main force has drawn for you.
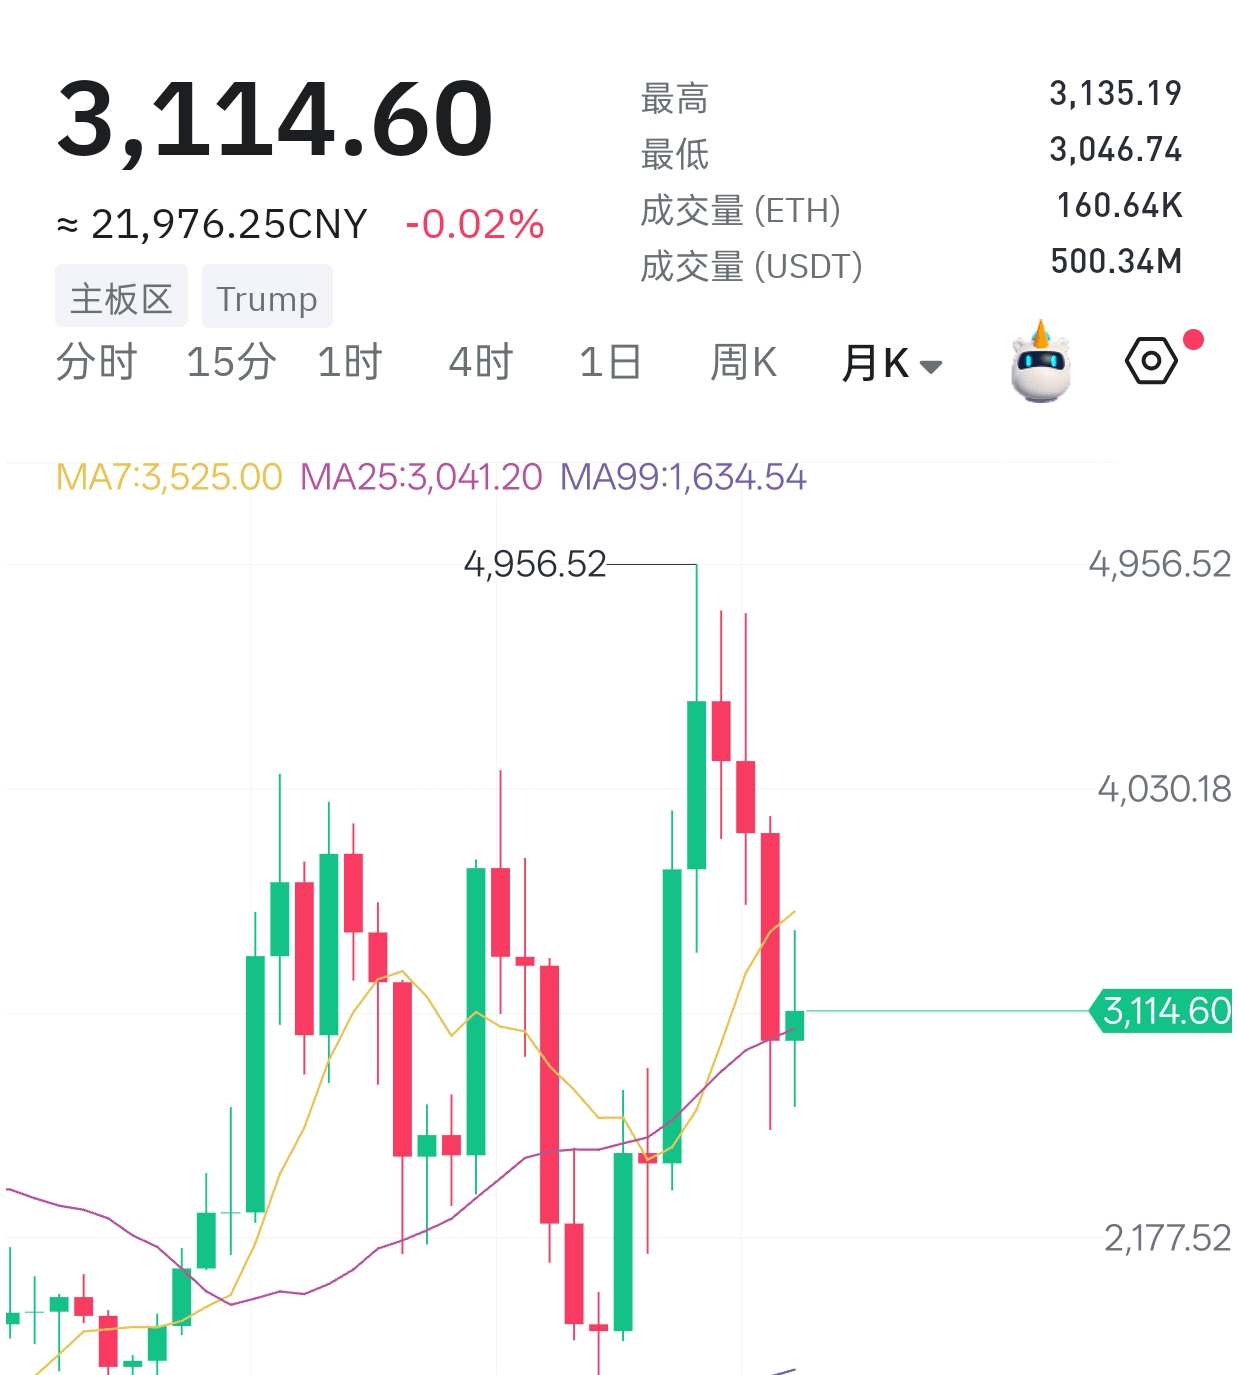
1. Daily line rebound: A performance of 'not having eaten'.
Look at Figure 1 and Figure 2, this rebound is weak enough to be heartbreaking:
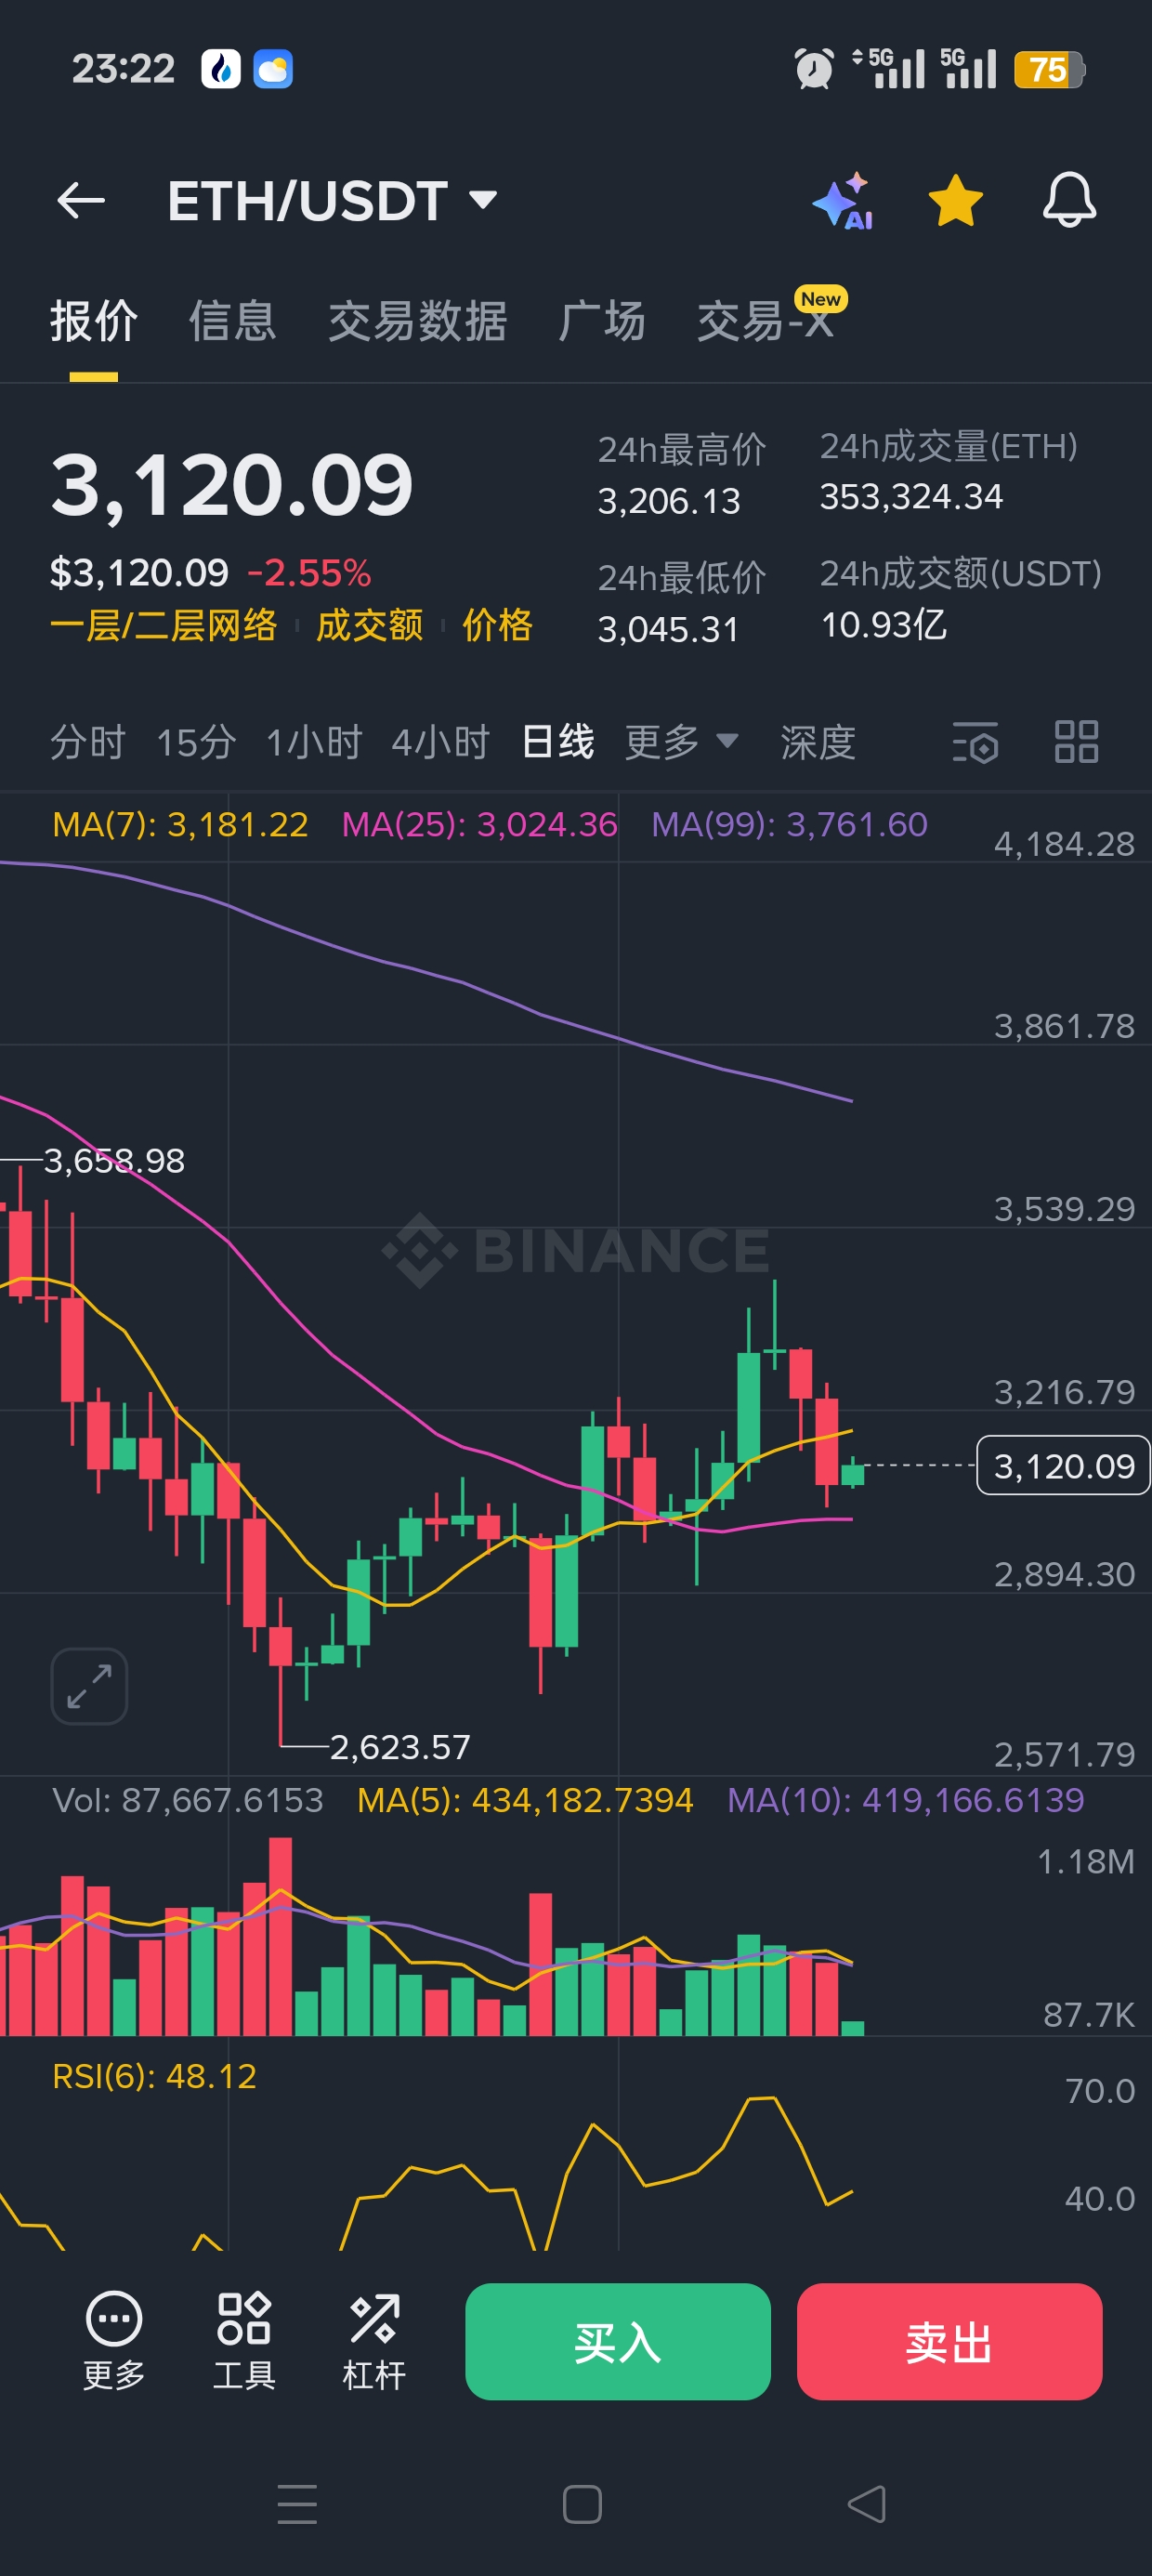
· Price rises, volume shrinks: The price rebounds, but the 24-hour trading volume has shrunk to just over 35,000 ETH, with a trading value of only 1.1 billion USD, significantly lower than a few days ago. This is called a 'no-volume rebound', which is just playing tricks.
· Moving average pressure: Current price $3120, daily MA7 is $3222. Not even touching the most recent moving average is like a high jumper not clearing the first low bar; can that be called strong?
· RSI weakness: RSI(6) is at 48, not even above the central strong and weak point of 50, indicating an extremely weak willingness for bulls to attack.
What does this rebound resemble? It resembles a seriously ill person who drinks a bit of water and looks rosy for 5 minutes. You think he has recovered, but in fact, his pulse is almost gone.
2. Core evidence: During the rebound, funds are still in 'great escape'!
The most terrifying chart is here (fund flow). This is the market's trump card:
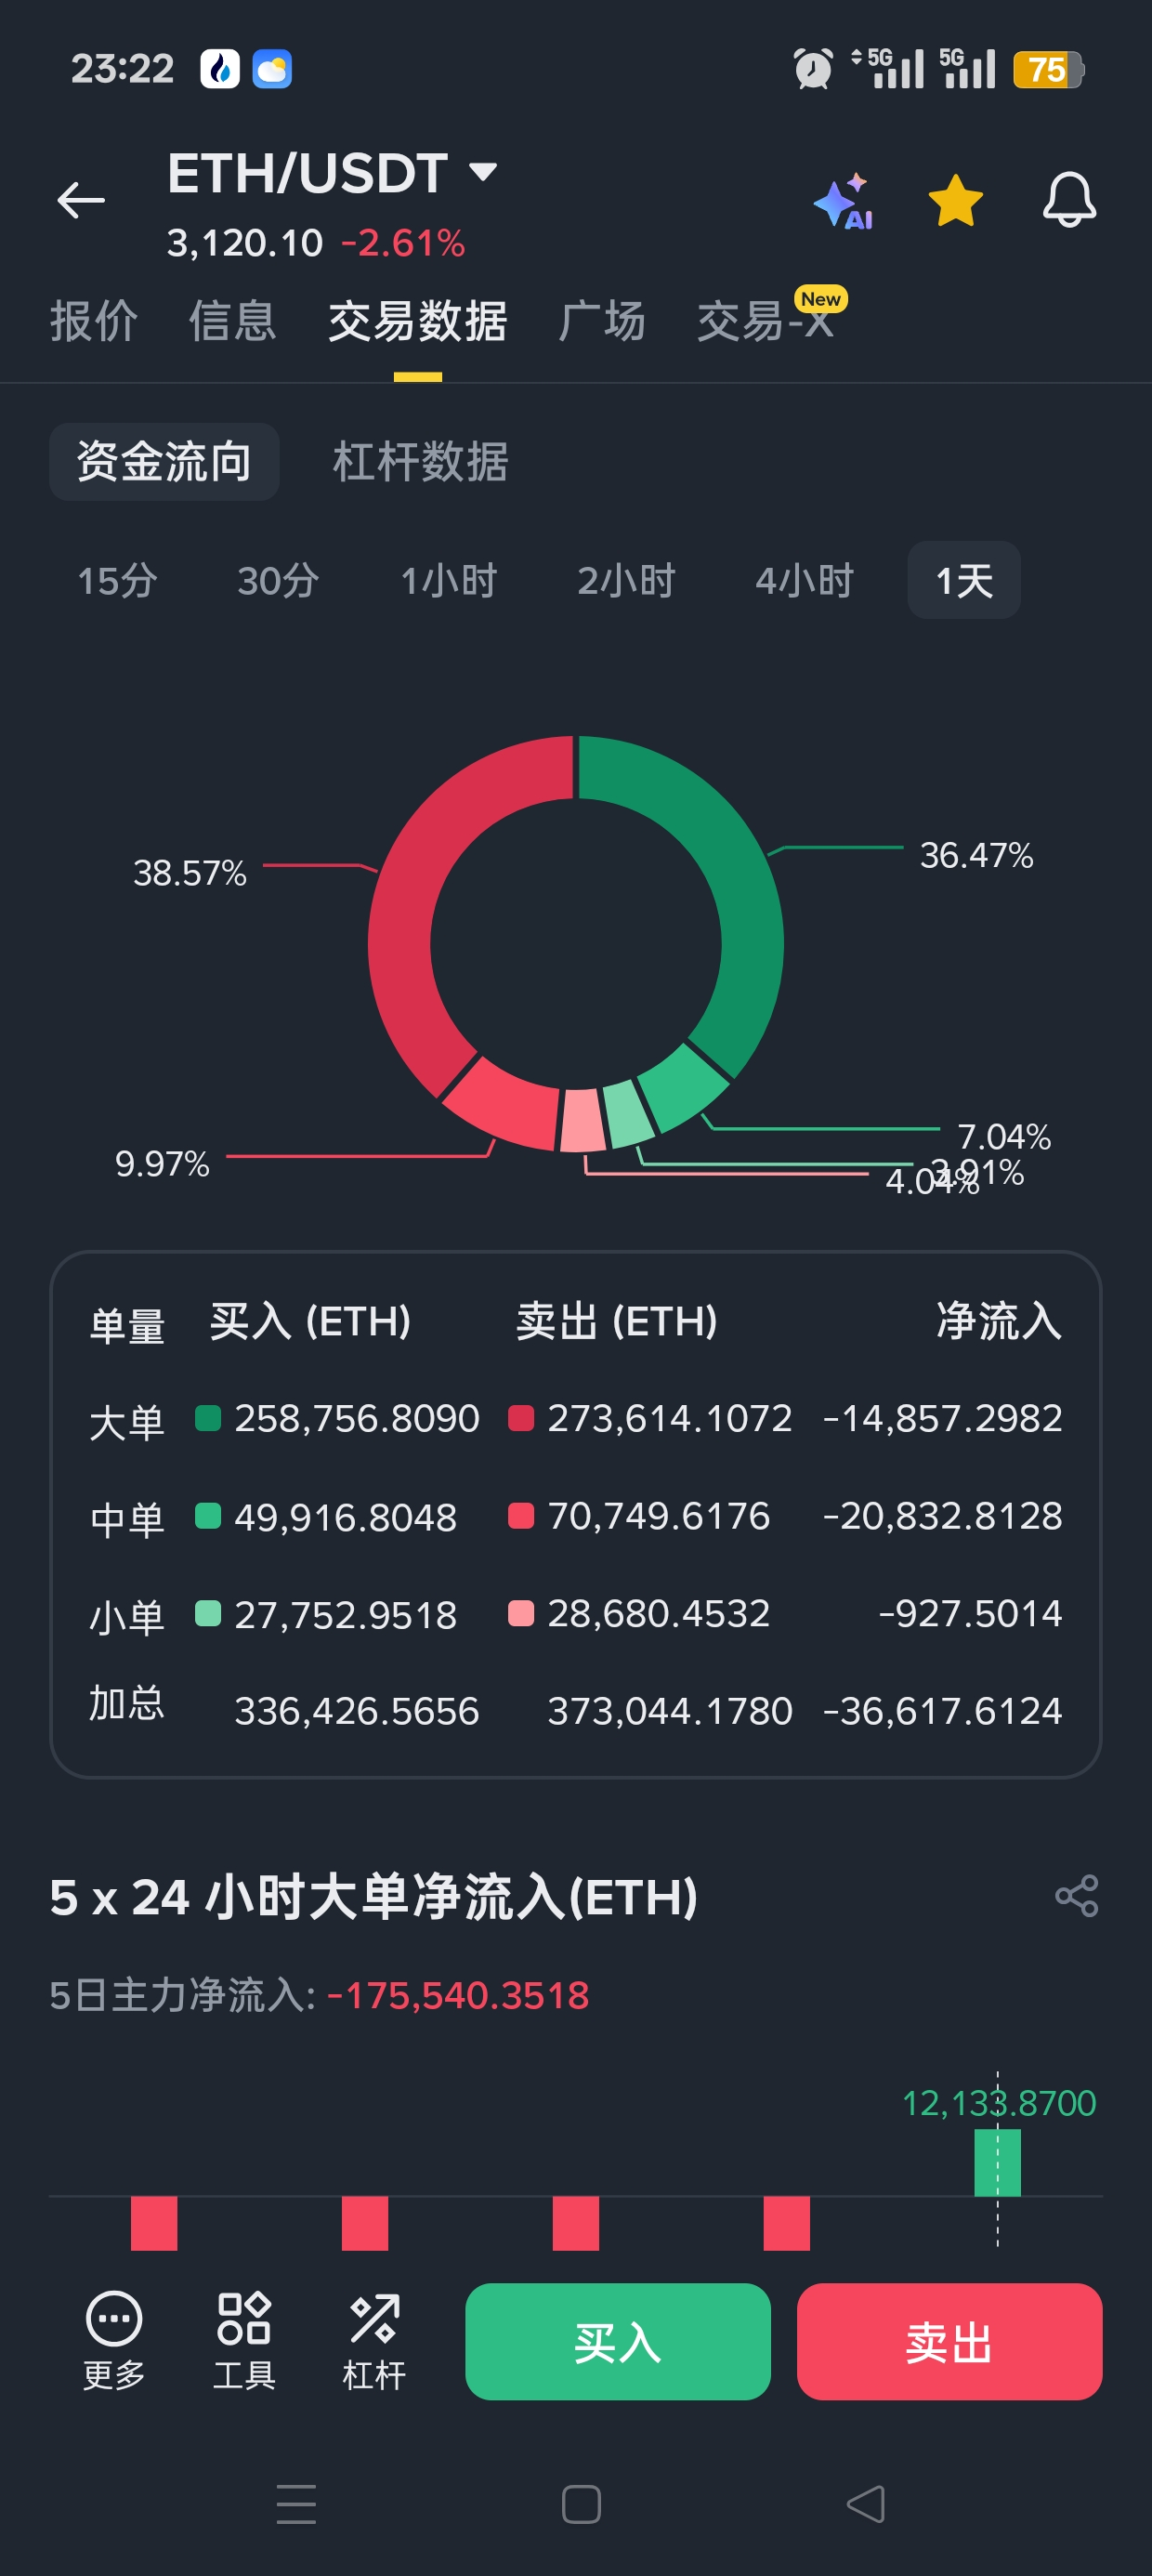
· Complete escape: Large orders, medium orders, and small orders, all net outflows, totaling -36,600 ETH. Note that this happened during the price rebound!
· Main force's intention: 5-day net inflow of -175,540 ETH. The direction is exactly the same as the previous days, just a bit slower. The main force takes advantage of the rebound to continue distributing chips at a better and more comfortable price.
Translation: The big players are creating the illusion of a rebound with small funds while quietly offloading with larger trays. Retail investors cheer 'the drop has stopped', while they count money backstage preparing to exit. Price rises with decreasing volume + fund outflows = a standard bait trap.
3. Weekly and monthly charts: Telling you what 'the trend has already passed' means.
Pulling the camera back, you'll gasp:
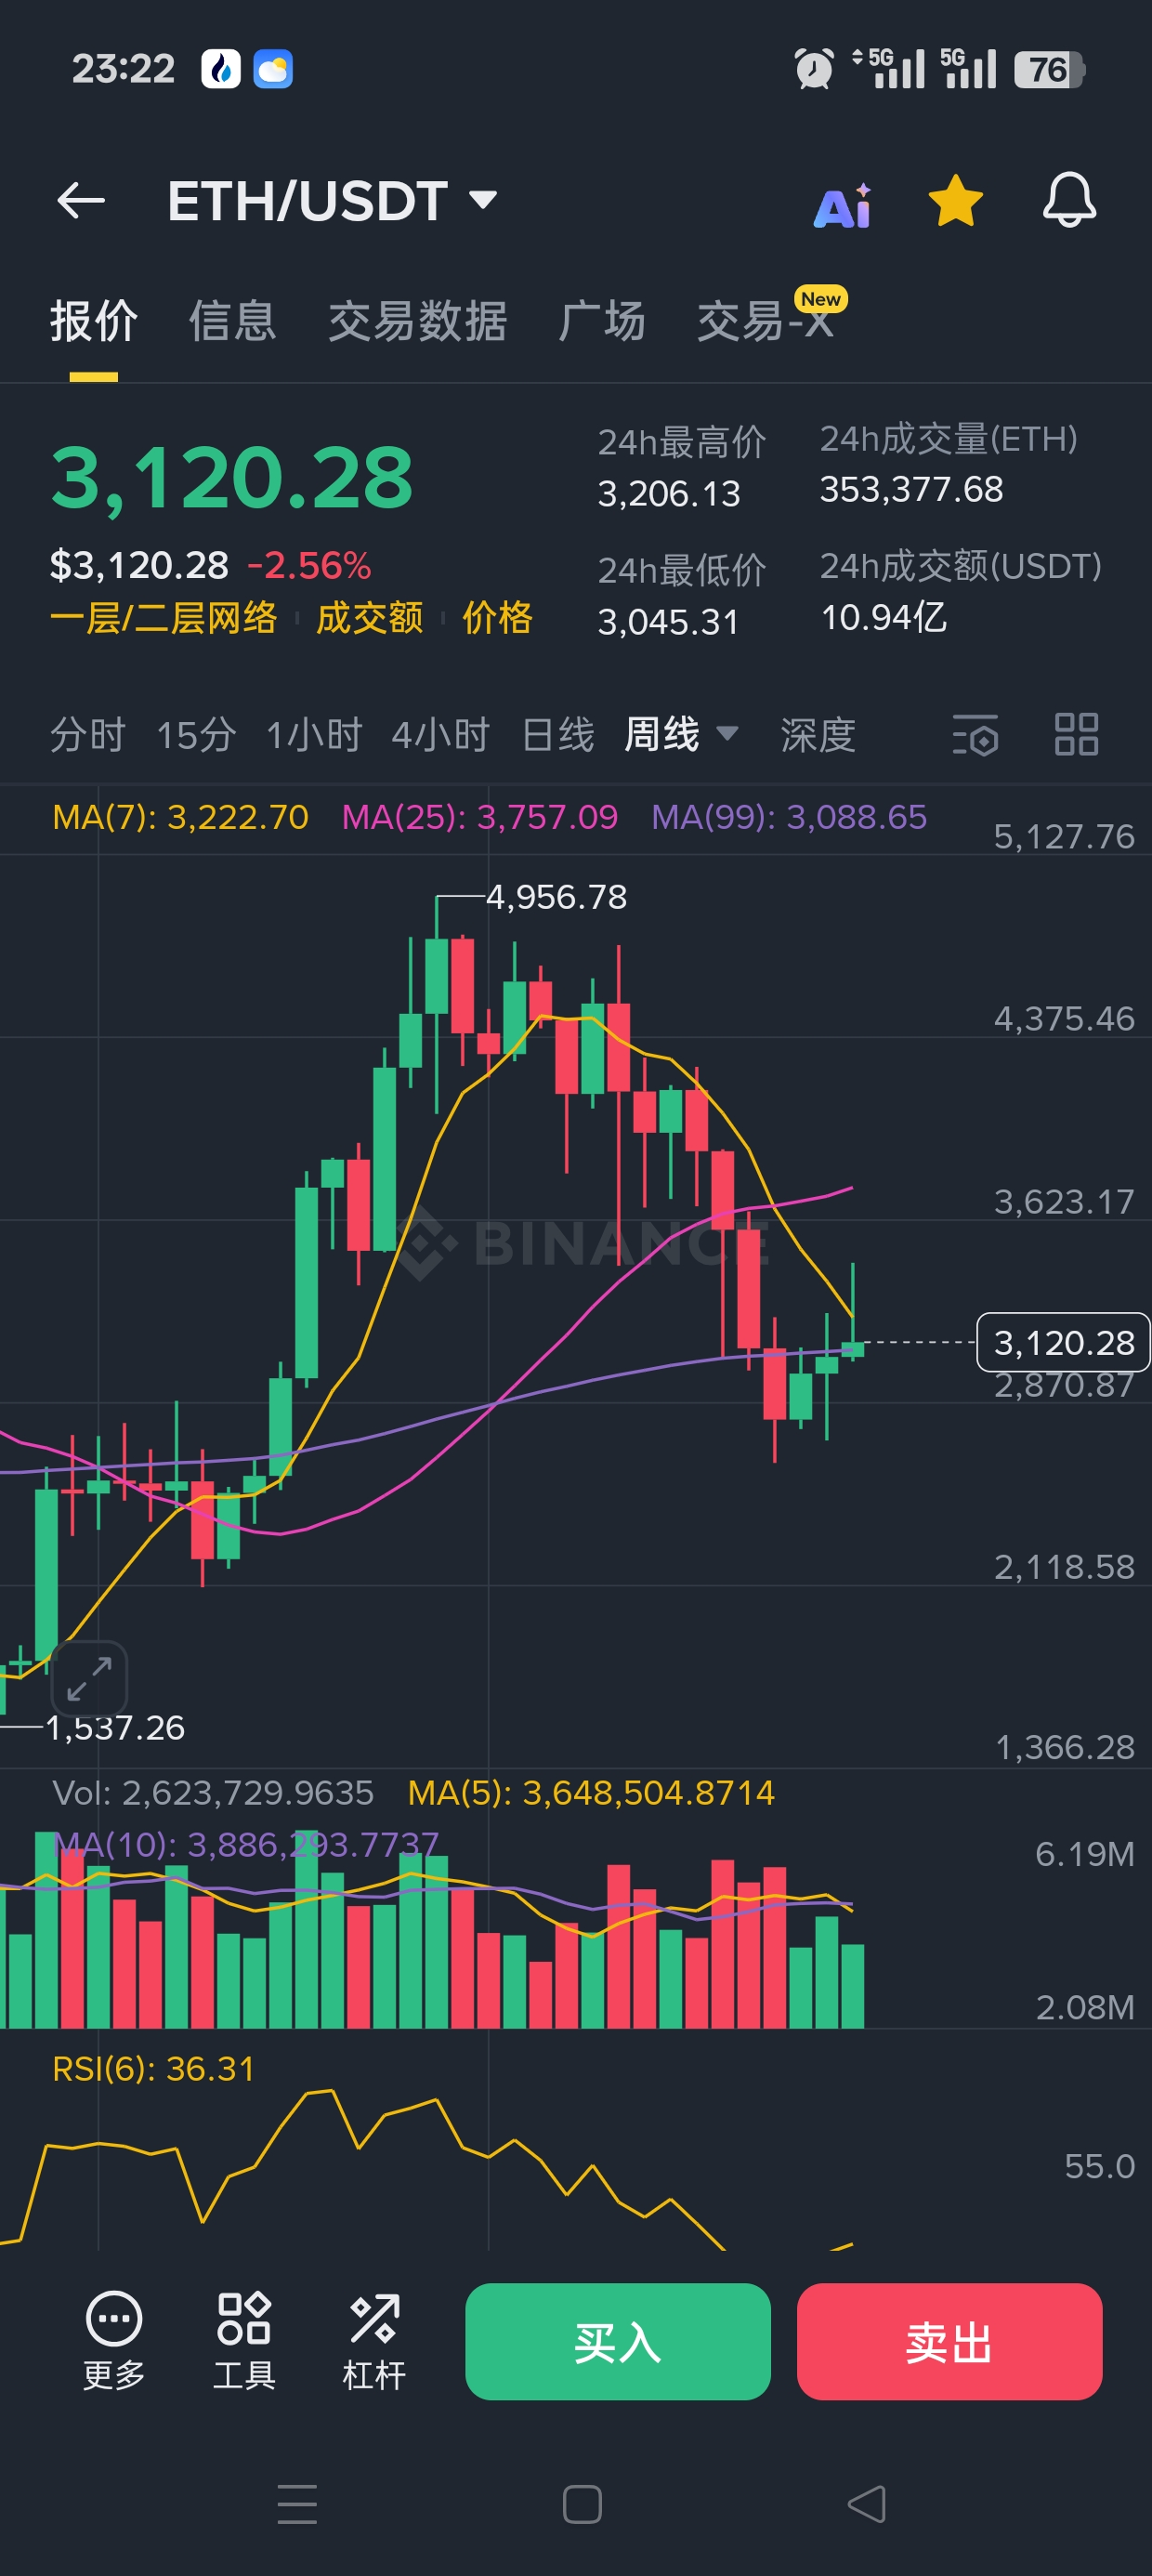
· Weekly chart: MACD value -190.48! Not much different from our last observation of -194, indicating that the bearish momentum at the weekly level has not decreased at all. The DIF and DEA lines are diverging downwards in deep water, and the bearish trend is incredibly smooth.
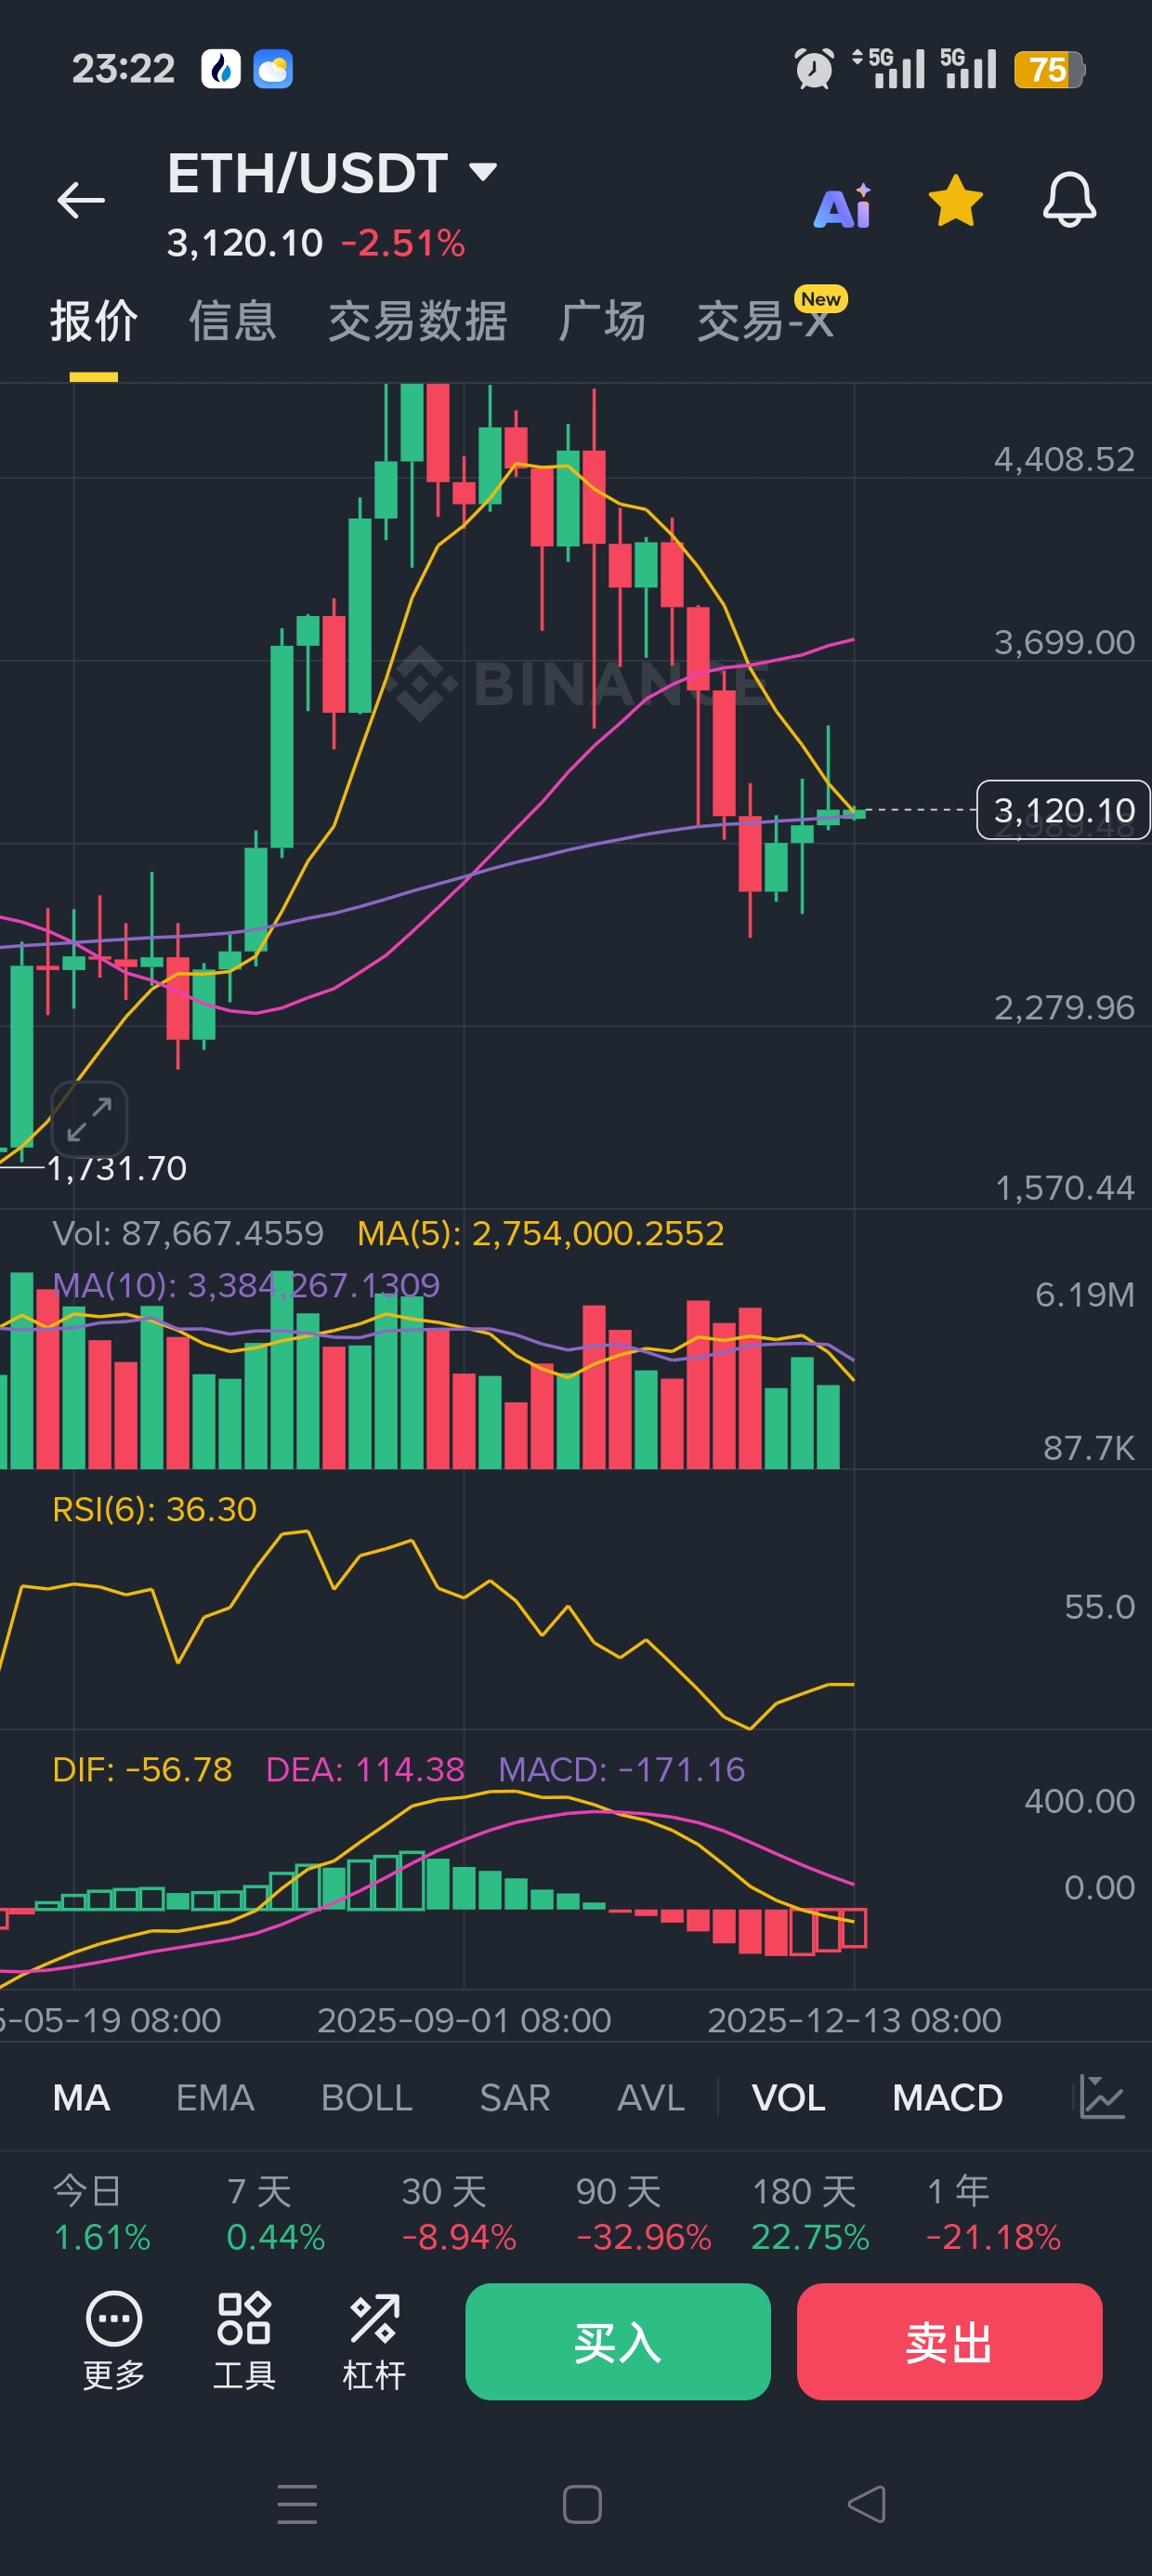
· Monthly chart: MACD is also huge at -171.16. A monthly level 'green momentum bar' this long usually corresponds to a long period of decline or bottoming, and it will not reverse in just a few days.
Joint combat map of three cycles:
Daily chart (tactical deception): Create a powerless rebound to attract bottom fishing and holding positions, creating liquidity for the main force to offload.
Weekly chart (strategic suppression): The downtrend is intact, like a mountain pressing down from above; any daily rebound is like a mantis trying to stop a car.
Monthly chart (stabilizing force): Long-term direction is downwards, determining that any mid-line long positions are against the trend.
A-Ping's practical strategy: What should we do now?
1. For those looking to go long: I offer you two words: hold on. The real long opportunity is 'the friend of the trend'. Now, the daily, weekly, and monthly trends are all downward; if you go long, you are going against the gravity of the entire market. Wait until the day when the daily line can consistently stabilize above MA7 and MA25, while the weekly MACD green bars begin to significantly shorten, then we can talk about going long.
2. For those holding positions: This rebound is the second opportunity the market gives you to reduce your position. The first was when the price broke down, and you might not have reacted in time. Now, with the rebound being weak and funds fleeing, it is a clear 'escape signal'. Don't fantasize about a V-shaped reversal; in a bear market, rebounds are meant to reduce your risk.
3. For those watching from the sidelines: you are the luckiest people at this moment. Holding cash gives you unlimited options. The market lacks nothing but opportunities; what it lacks is patience. What you need to do now is to continue watching the show, protect your bullets, and wait for that multi-cycle resonance with a higher certainty right-side signal.
Summary:
Current ETH, the daily chart shows 'no volume inducing more', the weekly chart shows 'continuation of decline', the monthly chart shows 'bear market pattern'. Price, funds, and cycles once again form a triple bearish resonance.
Don't be fooled by small rebounds of a few dozen dollars. In a downtrend, all rebounds are meant for a better drop.
Remember, in a bull market, you need to be bolder than anyone else; in a bear market, you need to be more patient than anyone else. Survive and wait for the wind to come.
I am A-Ping, follow me, using the toughest logic to expose the most flowery trends.
