according to the materials of the site - CryptoNewsLand

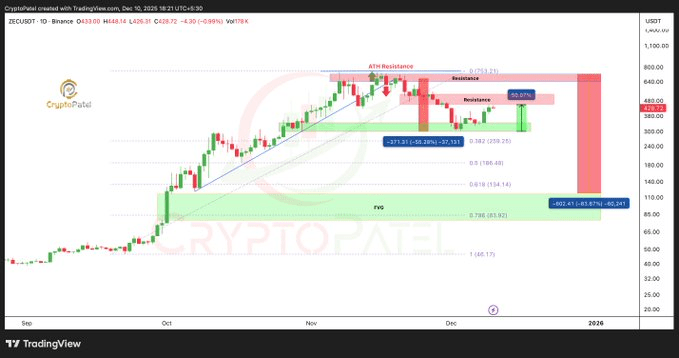
$ZEC demonstrated a strong recovery from the $300-350 range and approached $450, adding nearly 50%, while traders are now watching the resistance level at $500 for signs of the next directional change. The chart shows a large green bounce from support, as the price sharply increased after a deep fall that followed its previous peak around $700-750.
This movement has formed a new structure in the middle of the range, where $ZEC remains active, while market participants look for signs of strength or weakness at the next resistance level.
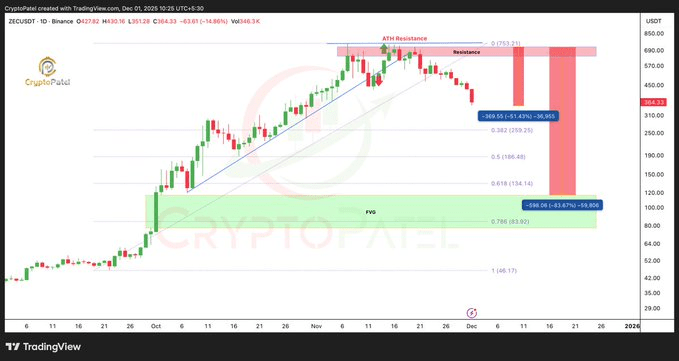
The recent rise followed a sharp decline of more than 55% from the previous all-time high of around $753.21, which pushed the token into a broad support zone around $300.
This area has triggered multiple reactions, and the chart shows a strong recovery candle that initiated the current bounce. This bounce broke through the lower resistance line and pushed $ZEC to the upper part of the structure.
The average zone formed as a result of the recovery is between $428 and $450 and now serves as an active trading zone. This area formed after the completion of the previous decline and the short-term control regained by buyers.
The level of $500 has been identified as the next important resistance zone. Comments indicated that traders would closely monitor this line, as a clear breakthrough and holding above $500 could open up further growth. If $ZEC fails to overcome this level, the chart suggests that the risk of a deeper correction remains, which could continue below the support level of $300. Some forecasts indicate potential targets even below the mark of $200 if pressure intensifies.
This creates a key moment for market participants, as the level of $500 may determine whether $ZEC continues its bounce or returns to the lower bands shown in the image.
The chart displays Fibonacci retracement levels, including 0.382 at $259.25, 0.5 at $186.48, 0.618 at $134.14, and 0.786 around $83.92. These levels indicate deeper correction zones if the token fails to overcome resistance.
A significant gap in fair value also appeared near the range of $134, which remains open and may attract price if momentum weakens. This area formed earlier in the trend and is still unfilled. The upper resistance zone near the all-time high is marked in red, where numerous failed attempts have created a ceiling. These repeated failures laid the foundation for a subsequent decline to the level of $300.
The price is currently above $428 and remains in a recovery block, where the chart shows a rise of more than 50 percent from the lows. Traders continue to monitor the current candles to see if momentum will grow as $ZEC approaches $500. The structure reflects a market that has swung sharply in both directions and is now at a possible turning point, awaiting a clear outcome in the resistance zone.


