Hedera is having a rough session, and the chart explains why. Over the past day, HBAR is down by a slight 1%, which represents a weekly loss of close to 8%.
Although the action is not that drastic, the price behavior is telling a clearer story. The sellers are still in control, and the market has not yet identified a convincing reason to pull back.
Entering the chart, HBAR is attempting to make a comeback following the loss of a significant level, with every small pull-back being sold off. This is typically a sign that a trader should exercise caution.
HBAR Losing Key Support Changed the Market Tone
The current weakness started when HBAR failed to hold above $0.132 on December 12. That level had been acting as support, but after several failed attempts to reclaim it, buyers ran out of momentum.
The HBAR price fell below that range, and the resulting drop saw sale activity increase, causing HBAR to move close to the $0.124-$0.123 levels.
Since December 11, the HBAR chart has been making lower highs, which is a typical bear setup. This is no simple pullback. This indicates that bears are entering earlier with each attempt at a bounce.
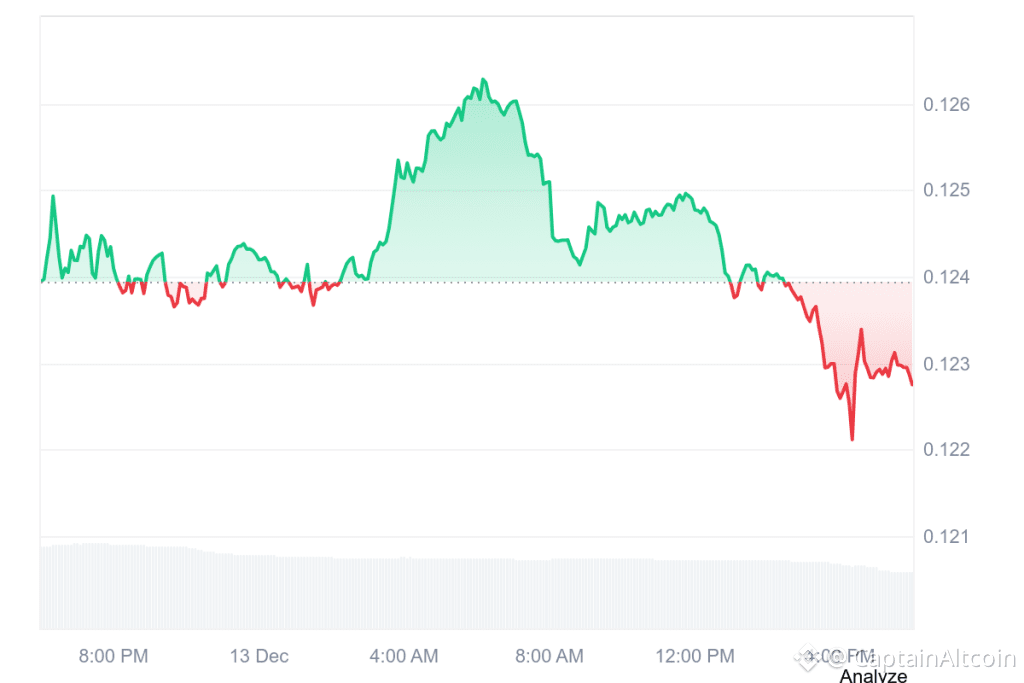 Source: CoinMarketCap/HBAR
The momentum indicators are a result of this shift. The RSI on a 7-day chart is currently at 28.9, which is in the oversold region, but the MACD is still negative. An oversold condition may indicate a bounce, but not necessarily the end of the downtrend.
At the current time, the price of HBAR is touching the 78.6% Fibonacci level at $0.1235. If this level cannot be supported, the traders would be waiting for a level that is closer to $0.115.
Hedera Volume Indicates This Isn’t Just Noise
One of the more important signals during this move is volume. Trading activity jumped to around 166M HBAR, roughly 175% above the recent average.
During the sharpest part of the selloff, hourly volume spiked several times above normal levels. That kind of volume usually points to conviction selling rather than panic from small traders.
When heavy volume lines up with a technical breakdown, it often indicates that larger players are reducing exposure. In HBAR’s case, the selling looks intentional, not accidental.
Read Also: Analyst Says Hedera Looks “Delicious” at These Levels, Updates His HBAR Price Outlook
Altcoin Conditions Are Still a Headwind
HBAR is also feeling pressure from the broader market. Bitcoin dominance has climbed to 58.56%, which typically pulls liquidity away from altcoins. At the same time, the Altcoin Season Index has dropped to 20, its lowest level since April 2025.
That environment makes it difficult for individual altcoins to recover on their own. Over the past 30 days, HBAR is down around 29%, clearly underperforming the broader crypto market, which is down closer to 10% over the same period.
What’s Next for HBAR?
HBAR’s dip today is not about one headline or sudden event. It is the result of a technical breakdown, heavy selling volume, and a market that currently favors Bitcoin over altcoins.
Unless Hedera can reclaim the $0.132 level, downside pressure is likely to remain. For now, the key question is whether support near $0.123 can hold or if sellers push the HBAR price into another leg lower.
Subscribe to our YouTube channel for daily crypto updates, market insights, and expert analysis.
The post Why Is Hedera (HBAR) Price Down Today? appeared first on CaptainAltcoin.

