
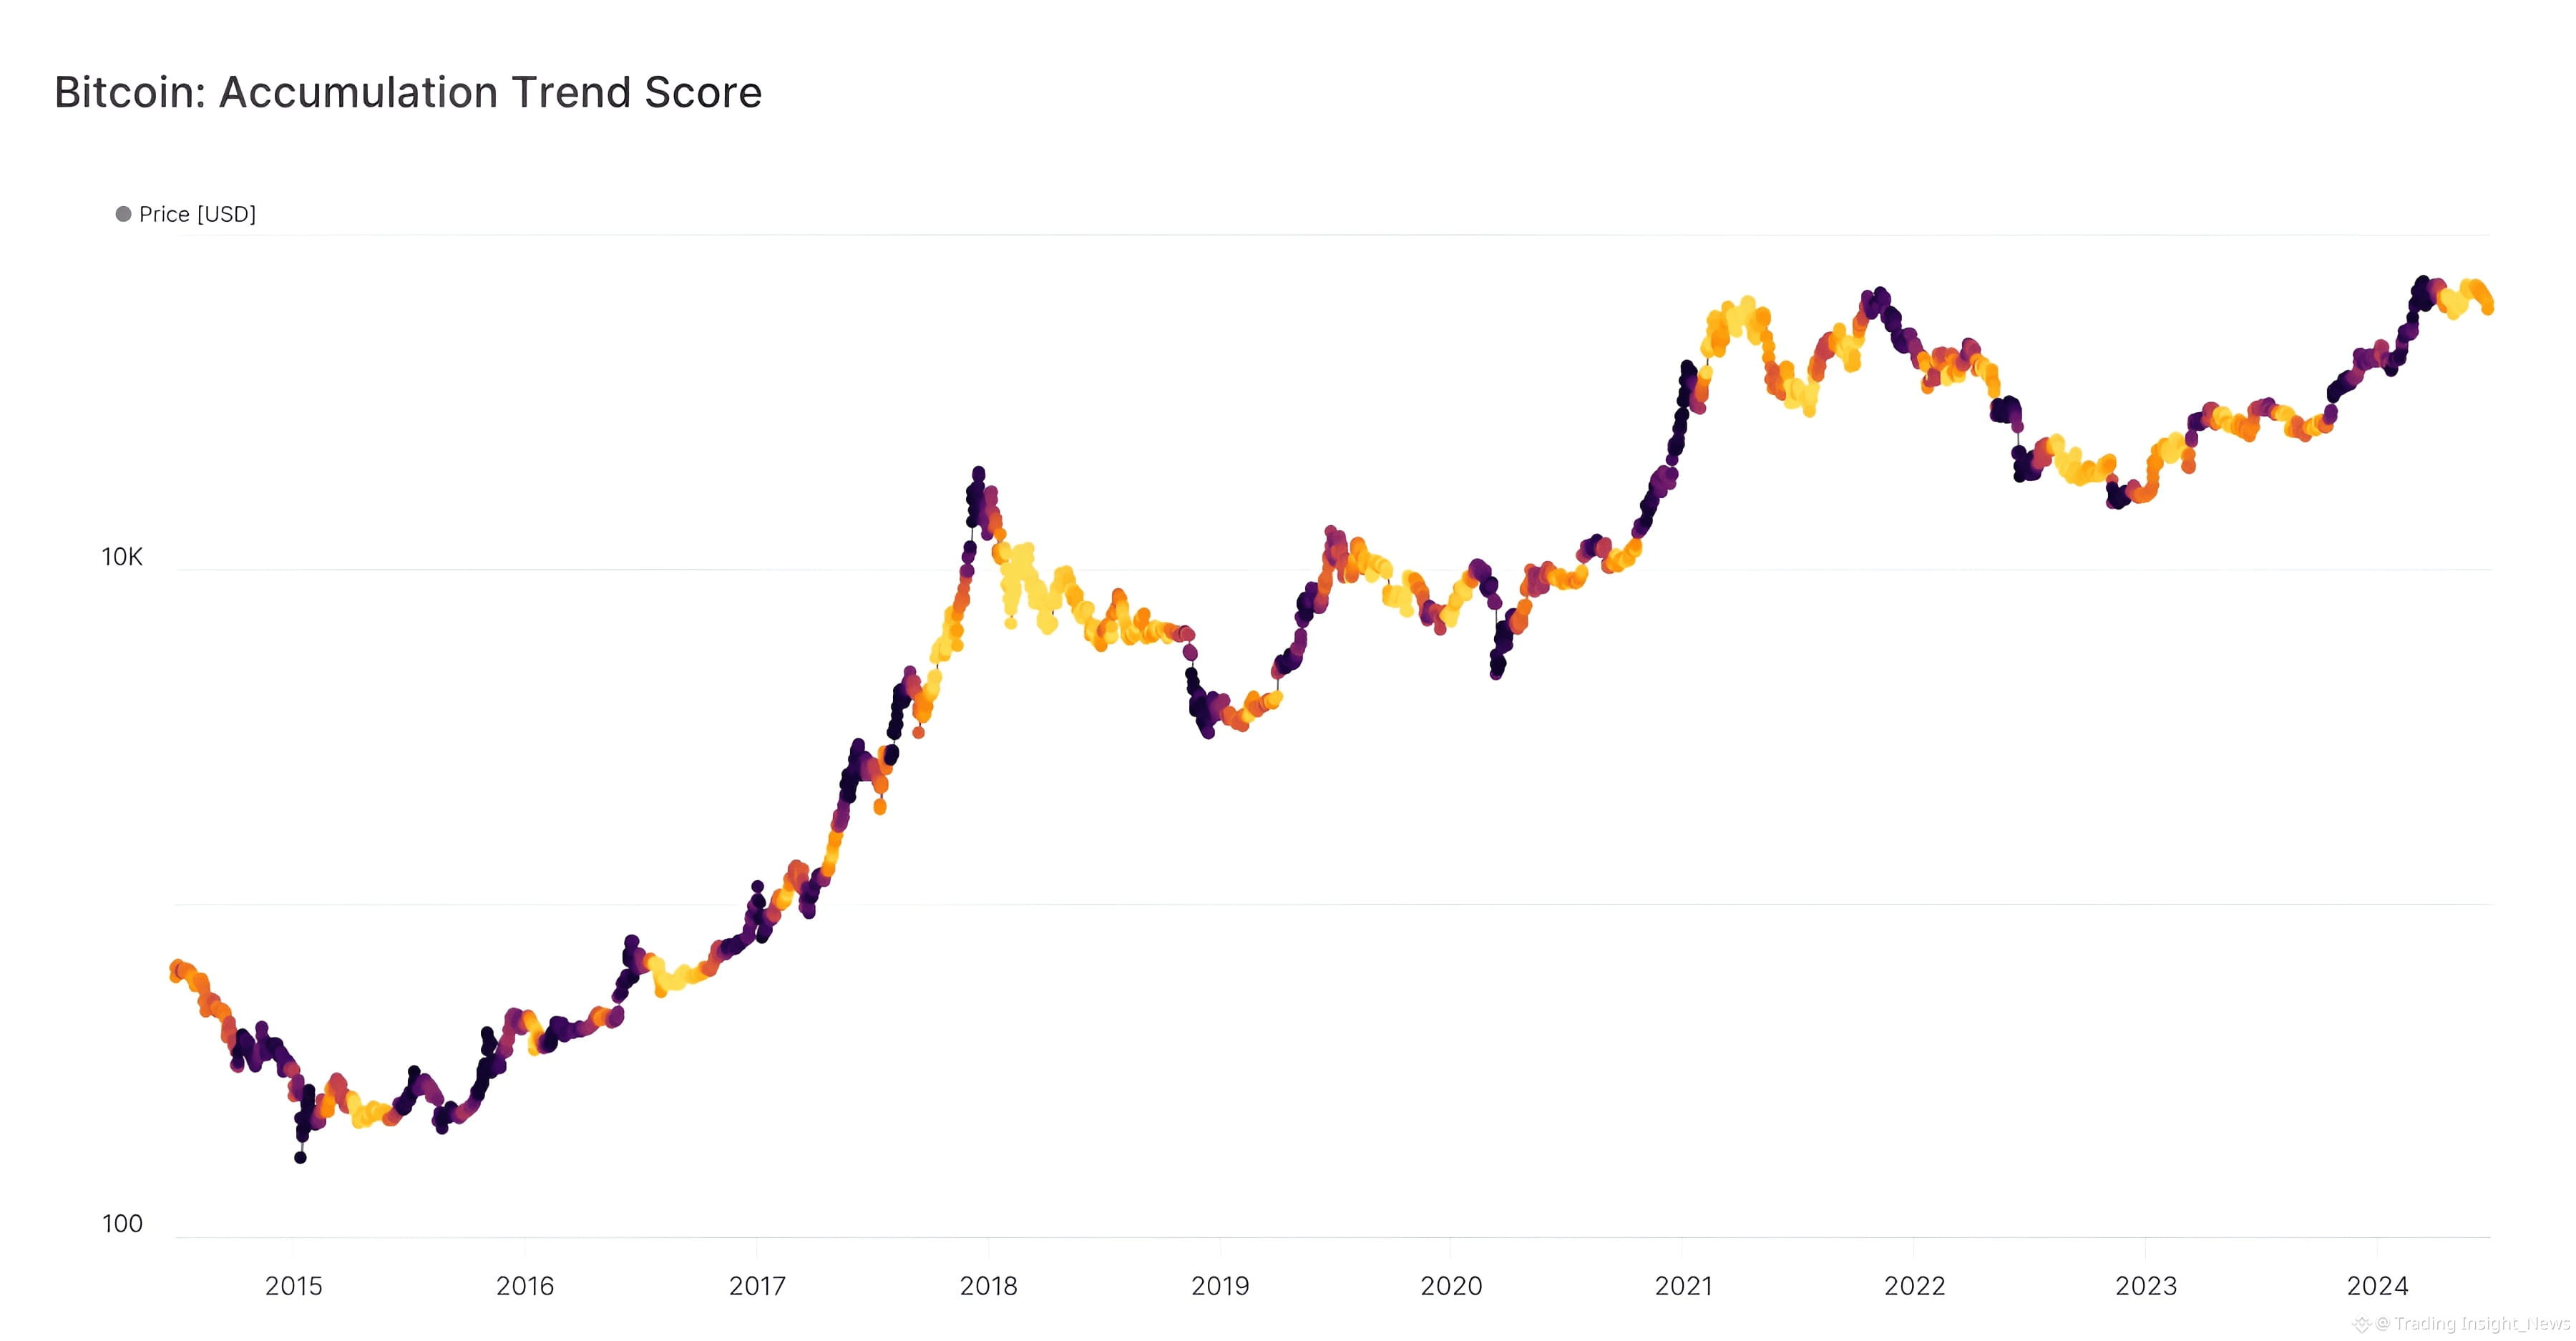
In technical analysis, price candles can be noisy due to short term Long/Short liquidations. But in Onchain analysis, money moving into wallets is undeniable proof. Accumulation Trend Score is the most visual color coded indicator helping you see through the behavior of the entire market, especially the Whales.
🔸 Accumulation Trend Score metric reflects the relative size of entities that are actively accumulating or distributing coins onchain. The score ranges from 0 to 1.
Dark Purple,Score near 1 👉 The Accumulation phase. This indicates that large entities and a large part of the market are net buying heavily. Their wallet balances are increasing significantly.
Light Yellow Score near 0 👉 The Distribution phase. This indicates that large entities are dumping or have stopped buying. Their wallet balances are decreasing.
🔸 Accumulation Trend Score secret weapon is The Bullish Divergence
Imagine Bitcoin price is dumping hard or ranging, causing the crowd to Panic Sell. However, the Accumulation Trend Score turns Dark Purple.
Price is dropping not because of a lack of buyers, but because Whales are setting traps to absorb all the sell pressure from retail. Smart money is using FUD to scoop up cheap coins.
👉This is often the most reliable bottom signal.
🔹Do not just look at red candles and panic.
If price crashes but the Heatmap turns Purple, buy with confidence. You are standing on the same side as the market movers.
If price hits a peak but the map turns Yellow, be careful; Whales are taking profit on your head.
Recall the last time you panic sold due to bad news. Did you check what the big wallets were doing? If you knew they were quietly accumulating while you were selling, would you have changed your decision?
News is for reference, not investment advice. Please read carefully before making a decision.
