Bitcoin has shown a bit of movement this Sunday a small dip on relatively low volume. While some may interpret this as a bearish signal, the broader market structure remains intact. In fact, nothing technically significant has broken, and no major wave count changes are required at this stage.
🔍 What Happened Today?
The move we saw today appears to be a small-volume weekend dump, possibly even a minor bear trap. These kinds of moves are common on Sundays, when liquidity is thin and nano-structure often shifts quickly.
Importantly:
No impulsive move to the downside has occurred
Key support levels are still respected
The broader consolidation remains intact
🔺 Triangle Structure: Still Valid (But Low Probability)
The triangle scenario we are tracking is still technically valid, although it remains a low-probability structure.
> Triangles are among the least reliable Elliott Wave patterns, especially on lower timeframes.
What’s important to understand:
The triangle is best seen as a snapshot in time
It could easily morph into a more complex B-wave
Minor changes in the micro or nano structure are to be expected
Educational Note 🧠
In Elliott Wave theory:
An E-wave must not break below the C-wave low
A high B-wave is allowed (similar to flat corrections)
This means an upside breakout remains possible
📌 Key takeaway:
Labels are not trade setups.
Trade setups come from 1–2 structures or clear ABC patterns, not from triangles alone.
📊 Where Support Really Matters
Despite short-term noise, support remains unchanged and respected.
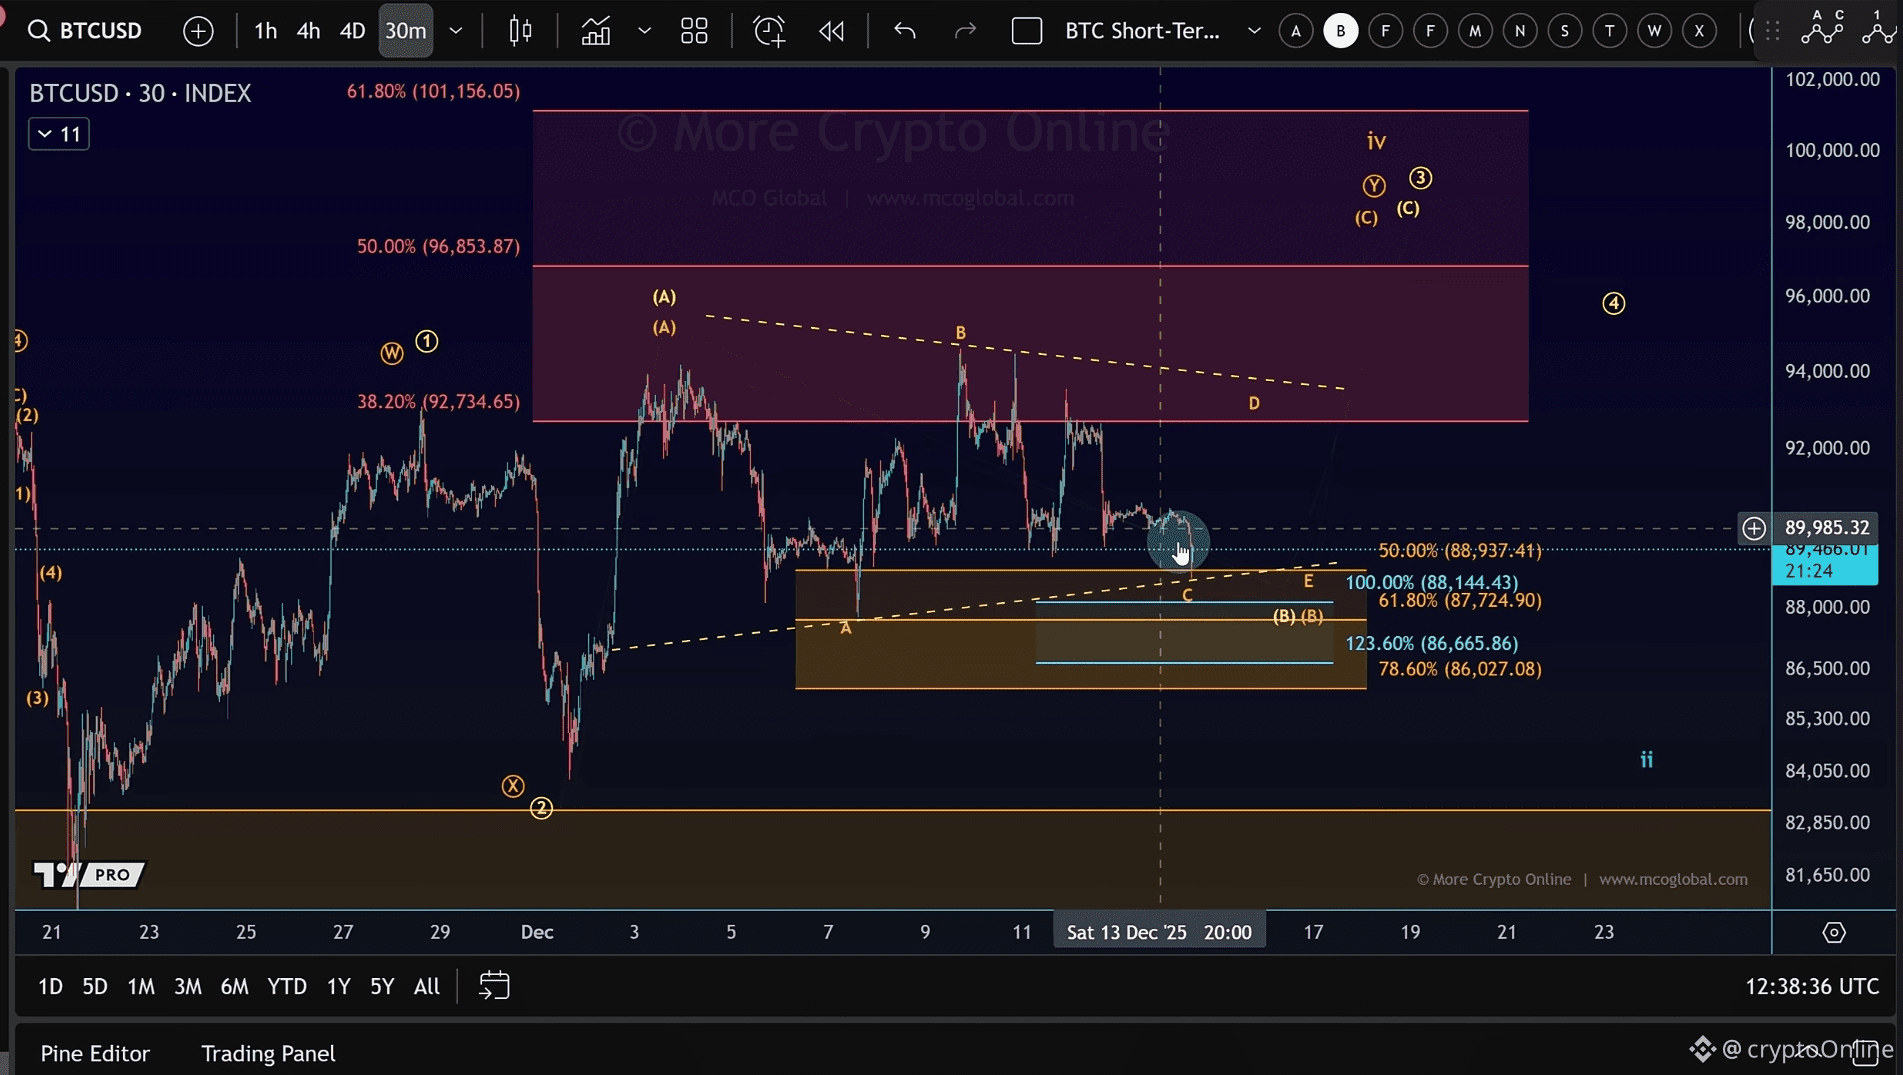
🔸 Key Support Zone (Fibonacci Retracement Area)
86,027 – 88,937
This zone has been tested multiple times:
December 5
Sunday, December 7
Again today
Each time, price has reacted positively, confirming the importance of this area.
📐 Fibonacci Reactions Observed
Multiple reactions at 50% retracement
Clear respect of the 61.8% retracement
This tells us that the market is still respecting technical levels, even in low-volume conditions.
The orange Fibonacci support box (86,027–88,937)
Multiple price reactions at 50% and 61.8%
Dates of previous tests clearly marked
🚧 Resistance Levels to Watch
Until resistance breaks, there is no confirmation that a low is in.
Key Levels:
~90,750 → Short-term swing high from Saturday
94,650 → Major December swing high (December 9)
Thursday’s high (Dec 11) → Critical level for trend confirmation
🧭 Big Picture: Sideways Consolidation
At the moment, Bitcoin remains in a sideways consolidation phase. When price action slows down like this, it’s often the best time to focus on education and structure, rather than chasing trades.
There is:
No impulsive downside move
No confirmed upside breakout
No reason to panic — or to force trades
