Alright team, let's break down this juicy $BTC chart and see what's cooking. The Weekly timeframe is flashing serious warning signs that macro traders cannot afford to ignore.
Technical Analysis
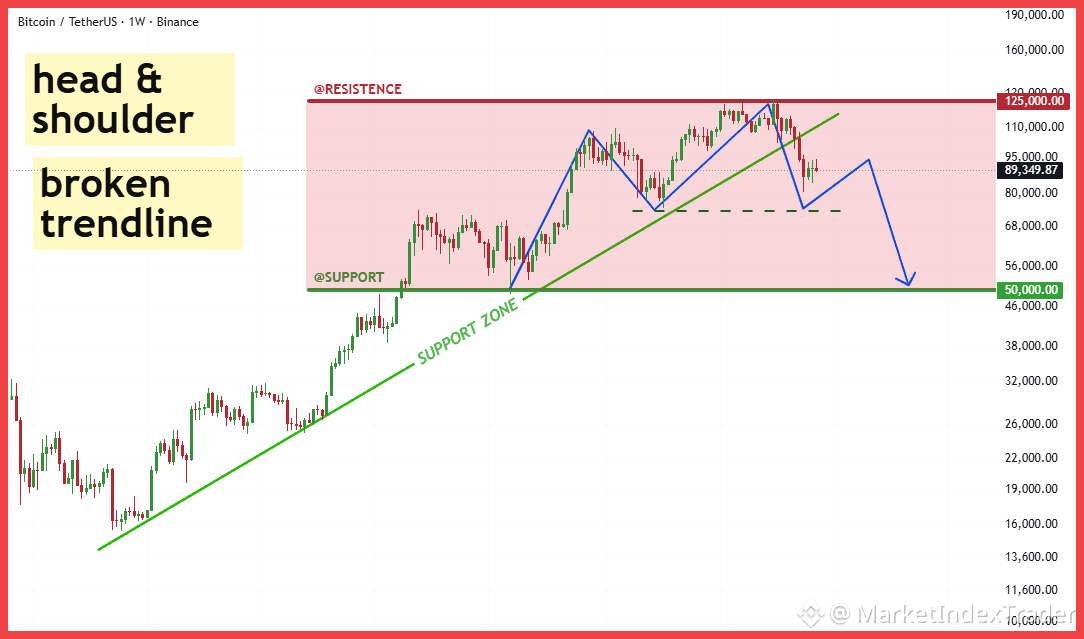
The chart shows a massive Head & Shoulders (H&S) reversal pattern near the top of the cycle, a bearish indication. Critically, the long-term parabolic uptrend support line (green line) has been decisively broken. The price is currently trading around $89,300 after failing to breach major resistance at $125,000.
If the intermediate support (neckline, around $75,000) is broken, the measured move target for this pattern aligns perfectly with the next historical strong support zone at $50,000. We might see a minor relief bounce (retest the broken trendline around $95,000) before confirming the larger downtrend.
Fundamental Analysis
Despite the scary chart structure, fundamental drivers remain strong. Institutional conviction, particularly via US Spot Bitcoin ETFs, continues to show consistent net inflows, signaling deep institutional demand. This adoption, coupled with the long-term supply shock anticipated post-halving, suggests that dips are high-value accumulation zones for patient investors.
Action Plan
Given the clear technical risk down to $50,000, risk management is paramount. While long-term bullish, short-term capital preservation is key. Accumulating near the $50,000 level would provide the best risk/reward for the next leg up.
Highly recommend HOLD and Stacking $BTC at Binance
Feel free to comment the altcoin you are holding and we will check it for you!
#BTC #Bitcoin #TechnicalAnalysis #Crypto #BinanceSquare #HODL
