Core viewpoint:
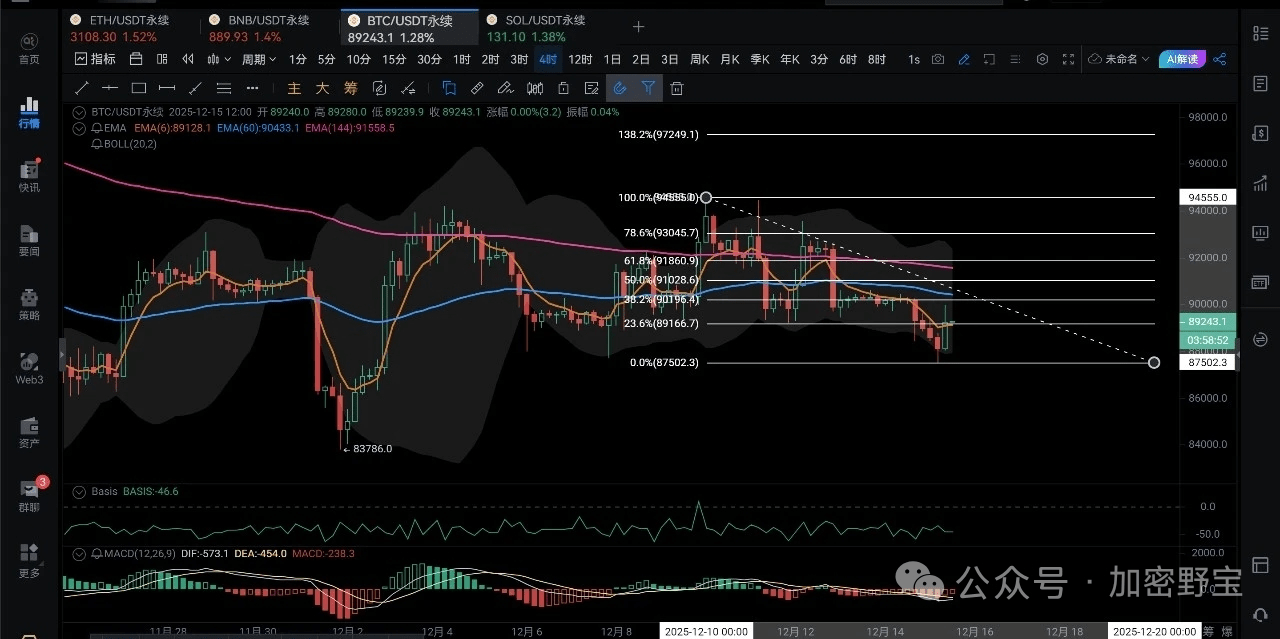
The daily level pullback has precisely reached the Fibonacci 50.0% key watershed and quickly rebounded, showing that there is strong bullish and bearish contention in this area. The current market focus is on the strength of the 4-hour level rebound; whether it can effectively break through the upper pressure zone of 90200-91047 will become the core basis for judging whether the daily chart continues to rebound or tests the bottom again. The overall pattern is still in a high-level consolidation, and the intraday approach tends to respond with a range-bound fluctuation. 1. Multi-period market analysis 1. Daily level analysis: Form: Today's chart shows a bearish candlestick in the daily K line, with the price retracing to the Fibonacci 50.0% key retracement level after receiving buying support, forming a lower shadow, indicating that there is technical buying at this position. Outlook: The short-term trend is highly correlated with the 4-hour cycle. If the 4-hour rebound can strongly break through and stabilize above 91000, the daily chart is expected to end the pullback and restart the upward trend; conversely, if the rebound is weak and blocked at the key pressure level, the daily chart may test support downwards again. Operational thoughts: Focus on the fluctuation within the range of 88500-91000, with a primary focus on high positions in the intraday fluctuation trend and low positions as a supplement.
2. Short-term technical analysis (1H/4H) 1-hour chart: MACD fast and slow lines form a golden cross below the zero axis, green momentum bars are increasing, EMA6 crosses above EMA60/144, showing a short-term rebound pattern, but overall still operates within the bearish zone below the zero axis. 4-hour chart: MACD fast and slow lines are below the zero axis, but the red momentum bars continue to decrease to hollow, indicating a decline in downward momentum, with obvious technical characteristics of "decreasing volume on the decline, brewing a rebound."
3. Comprehensive judgment that the market is in a sensitive period of transition between bullish and bearish. The 4-hour chart shows positive bottoming rebound signals, but the sustainability and strength of the rebound need to be verified. The daily line has gained some breathing room at key support levels, but the trend has not reversed. Intraday oscillation and consolidation are highly likely to occur within the range of 88500-91000 to digest the bullish and bearish divergence.
Two, key position summary
1-hour level pressure: 89820-905304 hour level pressure: 90200-91047
Three, intraday operation strategy
Core idea: Focus on the range of 88500-91000 for fluctuations, with a bullish bias for intraday fluctuations and a supportive bearish approach!
Finally, if you find my strategy insights helpful, please like and follow. I will use my ten years of trading experience and effective trading systems to help you gradually become wealthy!

