After breaking below $2.00, XRP price fell again. The current price trend is weak, facing resistance near the $2.020 resistance level.
XRP price has broken below the $2.00 area and started a new round of decline.
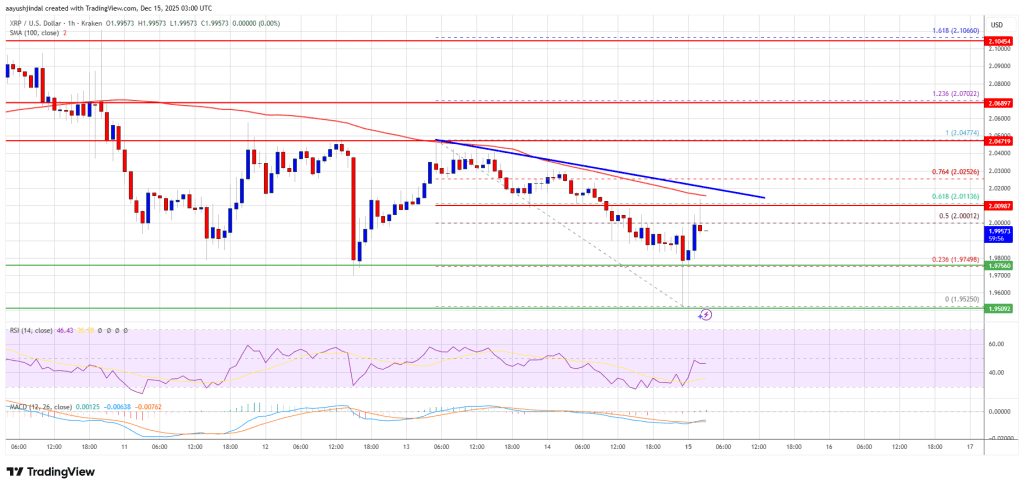
The current price is below $2.00 and the 100-hour simple moving average.
A descending trend line is forming on the XRP/USD hourly chart, with resistance at $2.020 (data source: Kraken).
If the currency pair breaks below $1.950, it may continue to decline.
XRP price has fallen again.
XRP price attempted to rebound above $2.120 but failed to continue rising like Bitcoin and Ethereum. Subsequently, the price began a new round of decline, breaking below $2.050 and $2.020.
The price broke below the support at $2.00 and formed a low near $1.9525, then began to bounce back. The price broke through the 50% Fibonacci retracement level of the drop from the high of $2.047 to the low of $1.952.
However, the bears are active around $2.00 and $2.020. A resistance trend line is also forming on the XRP/USD hourly chart at $2.020. The current price is below $2.00 and the 100-hour simple moving average.
If the price rises again, it may encounter resistance near $2.00. The first major resistance level is near $2.020, which is the 61.8% Fibonacci retracement level from the drop from $2.047 to $1.952.
If the closing price is above $2.020, it may rise to $2.050. The next resistance level is at $2.080. If it can effectively break through the resistance at $2.120, it may move towards the resistance at $2.150. If it continues to rise, it may further test the resistance at $2.20. The next major resistance level faced by the bulls may be around $2.250.
Another decline?
If XRP fails to break through the resistance at $2.020, it may trigger a new round of declines. The initial support level downwards is around $1.9650. The next major support level is around $1.950.
If the price breaks down and closes below $1.950, it may continue to decline to $1.920. The next major support level is around $1.880, and if this support level is broken, the price may continue to fall to $1.820.
Technical Indicators
Hourly MACD Indicator – The MACD for XRP/USD is currently accelerating downward in the bearish zone.
Hourly Relative Strength Index (RSI) – The RSI for XRP/USD is currently below the 50 level.
Major support levels – $1.950 and $1.920.
Major resistance levels – $2.020 and $2.050.
