📉 $ICP /USDT Technical Analysis (1-Hour Chart)
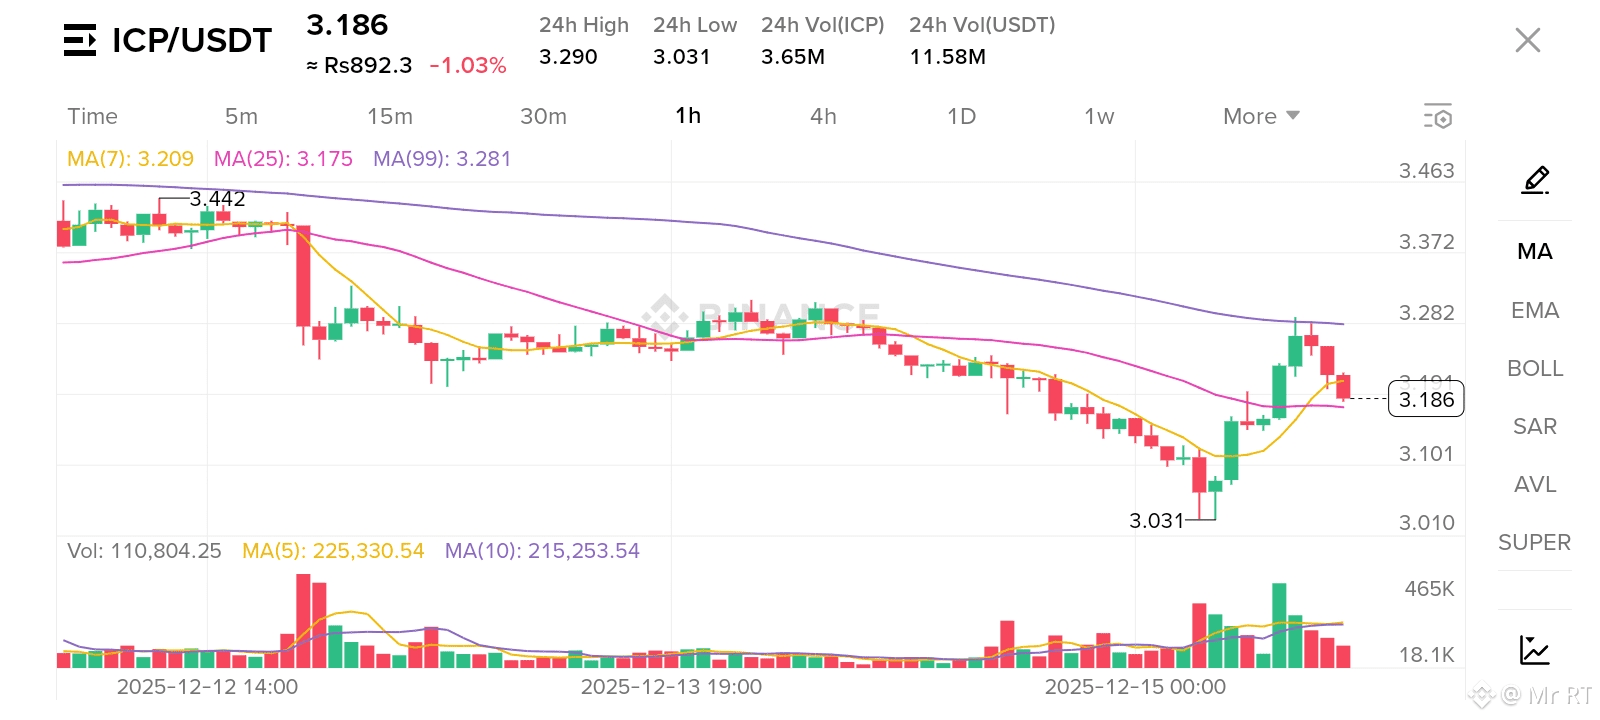
The chart displays the price action for the Internet Computer (ICP) against Tether (USDT) on a 1-hour timeframe, using candlestick bars and three Simple Moving Averages (SMA): MA(7), MA(25), and MA(99).
📊 Key Indicators & Observations
| Indicator | Value (Approx.) | Observation | Implication |
|---|---|---|---|
| Current Price | $3.186 | - | Below the major MAs, but recovering from a recent low. |
| MA(7) - Yellow | \approx 3.209 | Price is below the MA(7). The 7-period MA is starting to flatten/turn down slightly. | Short-term momentum is waning after the strong up-move. |
| MA(25) - Pink | \approx 3.175 | Price is above the MA(25). This MA has been acting as a key dynamic support/resistance. | Short-term trend is struggling to turn bullish. |
| MA(99) - Purple | \approx 3.281 | Price is significantly below the MA(99). The MA(99) is sloping downwards. | The intermediate to long-term trend (on this 1-hour chart) remains bearish. |
| Volume (24h) | Vol(ICP): 3.65M, Vol(USDT): 11.58M | A significant volume spike occurred during the sharp bounce off the low of $3.031. | The bounce had strong conviction (buying pressure), but recent volume is decreasing. |
| Recent Low | 3.031 (Dec 15, 00:00) | This is the recent support level. | A test of this level is possible if the current recovery fails. |
| Previous High | \approx 3.275 (Dec 15, 04:00) | This is the immediate resistance level, near the MA(99). | A break above this suggests a stronger reversal. |
💡 Moving Average Crossovers and Trend
* Bearish Alignment: The MAs are currently ordered MA(99) > MA(7) > MA(25) (approx. 3.281 > 3.209 > 3.175 at the chart's last data point). This alignment, particularly with the price below the MA(99), confirms a predominant downtrend on this timeframe.
* Recent Bullish Signal Failure: The sharp upward move on Dec 15 attempted a rally, but the price has since failed to sustain a position above the MA(7) and is currently consolidating between the MA(7) and MA(25).
🔮 Prediction of Next Move
Based on the current technical setup:
* Immediate Term (Next few hours): The price is in a tight consolidation phase near the 3.186 level. The struggle to stay above the MA(7) (\approx 3.209$) suggests the bullish momentum from the bounce is fading. The market is testing the MA(25) as support.
* Scenario 1 (Most Likely - Consolidation/Slight Pullback): ICP will likely consolidate sideways or experience a slight pullback towards the 3.15 to 3.17 area (testing the MA(25) again), as it looks for more volume to attempt a breakout above the MA(7) and the 3.20 psychological level.
* Scenario 2 (Bearish Continuation): If the price breaks and holds below the MA(25) (\approx 3.175) with increasing volume, it could signal a return to the broader downtrend, targeting the recent low of 3.031.
* Scenario 3 (Bullish Breakout): A sustained break and candle close above the MA(99) resistance (\approx 3.281) would be a strong signal for a short-term trend reversal, potentially leading to a test of the previous swing high near 3.442.
Conclusion: The path of least resistance still appears to be downward until the MA(99) is decisively broken. The immediate move is likely sideways consolidation with a slight bearish bias. The key levels to watch are the resistance at 3.281 (MA(99)) and the support at 3.175 (MA(25)).
Disclaimer: This analysis is for informational purposes only and is not financial advice. Trading cryptocurrencies is highly volatile and carries a significant risk of loss. Always conduct your own research.