Golden cross flashes, with hidden volume surging, a battle between bulls and bears is quietly unfolding at Giggle.
Today, as soon as I opened my eyes, the backend was overwhelmed again. Don't panic, we don't look at emotions, we only look at the charts. The answers you want are all in these candlesticks and a series of data.
First, look at the present:
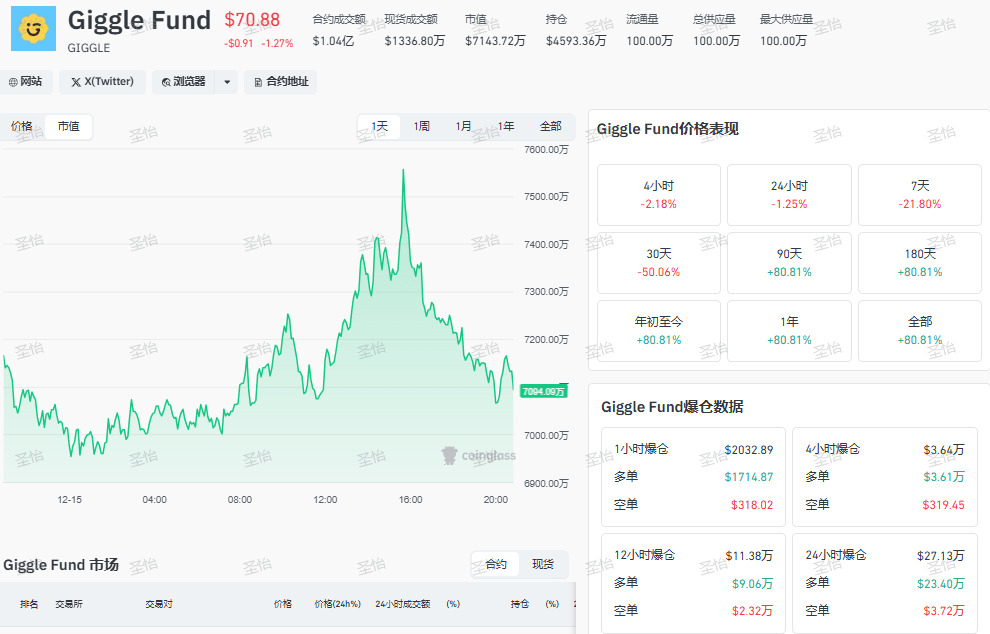
Giggle current quote around 70.88. 1-hour chart, trend upwards, like a dragon spine slowly lifting its head. But what do players fear the most? They fear missing out when it rises and fear deep losses when it falls.
On the news front, the overall market sentiment has been warming up recently, but when it comes to a specific cryptocurrency, the technical indicators always lead the news. The capital layout and golden cross signals we see may be the predictions of some 'smart money' for the future.
The market is born out of despair and grows in hesitation. Now, Giggle's chart language is shifting from hesitation to a bit of determination.
But there is one heartfelt statement that must be made: all the above analysis is based on the existing charts. The market changes rapidly, and the only constant is risk. Be sure to set your stop-loss; if 70 is effectively broken, the short-term logic needs to be reassessed.
But just having the signal is not enough; we need to look at the strength (trading volume). The 'concept' data at the 4-hour level (which you can understand as the movement of large funds) shows that long positions have reached 36,100, far exceeding the short positions of 319.45, with a ratio of over 10:1. Large funds are quietly gathering.
Let's get straight to the core: let the charts speak.
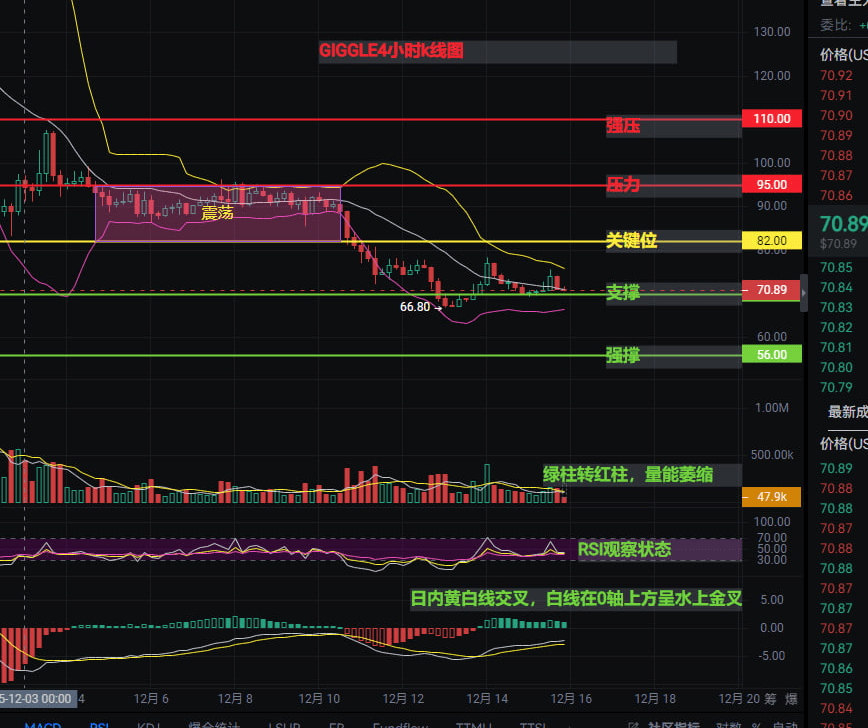
The first key signal is in the MACD. Did you notice? At the 1-hour level, the yellow and white lines have just completed a crossover, and the white line is firmly above the 0 axis — this is the so-called 'golden cross on the water.' In the eyes of technical analysts, this is a clear signal of the short-term recovery of bullish strength.

My opinion is very clear: the road must be taken step by step. There is a probability of a direct ascent, but the market needs 'healthy pullbacks' more. The first key resistance is in the 82-85 area, which is a small platform recently. The real pressure zone is at 95, which is the peak that has been tested multiple times without breaking. As for 110, that is the vast sea of stars, requiring the right timing and greater capital consensus. The most critical first support is around 70. This is a fortress that has been confirmed through multiple recent pullbacks; if reached, it will be a prime position for short-term rebound speculation, looking at the range of 70-82.
The ultimate strong support is in the 56 area. This is the lifeline of this round of rising, and if there is a deep correction in this wave, it is very likely to stabilize at this position. When it reaches here, it will be an excellent opportunity for medium to long-term layout.
If you are unsure about the specific entry points, you can pay attention to Shengyi. Friends who have followed me for 24 hours can get real-time reminders; follow Shengyi, + join the chat room to help you avoid pitfalls, and analyze the subsequent capital trends at the first moment to seize every window for profit!


