
SOL forms a rising triangle structure with higher lows and steady resistance, indicating growing pressure as traders track the tightly compressed price range.
Liquidity zones at $138–$142 and $145 guide intraday movement, showing where active buy and sell orders continue to influence SOL’s market behavior.
Liquidity cycles reflect recurring phases that accompany SOL’s trend shifts, with resets often preceding renewed activity that supports upcoming market movements.
SOL price continues to demonstrate resilience as market participants monitor its price action closely. Traders are observing patterns that indicate potential bullish continuation, despite occasional pullbacks. Current technical structures suggest pressure is building toward a decisive move.
SOL Builds Pressure in an Ascending Triangle
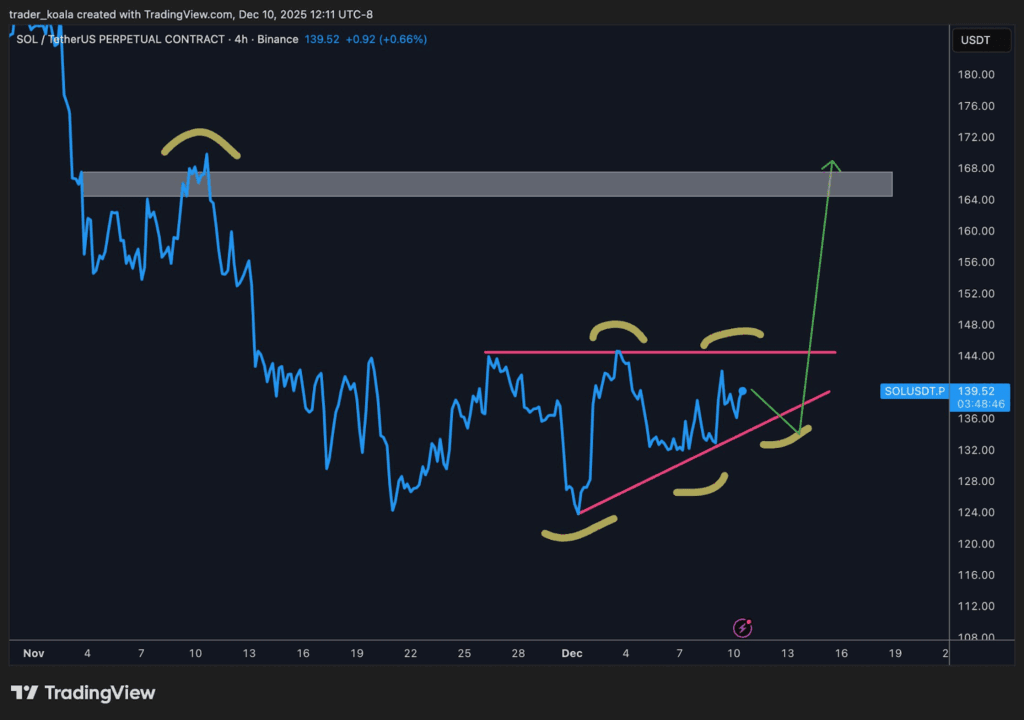
SOL/USDT has formed an ascending triangle whereby the lower trendline shows progressively higher lows, while resistance remains near $144. This setup indicates buyers are stepping in earlier during each pullback.Repeated rejections from the $144 resistance and firm responses along the rising trendline reinforce the triangle’s integrity.
 Solana Price Chart / Source: X
A breakout above $144 could open the path toward the $160–$168 supply zone. This area previously acted as strong resistance and may attract sellers again.
Small downward retests of the trendline remain part of the normal price structure. Traders note that as long as the trendline holds, the bullish bias persists. A breakdown below it could weaken the triangle and allow sellers to gain momentum.
Liquidity Levels Are Shaping SOL Moves
SOL’s price has interacted consistently with concentrated liquidity zones, shaping intraday movements. Bright orange and yellow bands represent heavy buy and sell orders, while darker areas indicate low liquidity where price moves more freely.
Earlier movements saw SOL descend through multiple liquidity shelves, pausing at visible zones. Mid-chart, the $138–$142 region acted as a magnet, attracting repeated price interaction and reflecting strong market participation.
https://twitter.com/CW8900/status/1999009065188602341?s=20
A rally toward $145 faced rejection at one of the thickest liquidity layers, confirming strong sell pressure. Support near $130 formed another active liquidity zone, illustrating how these levels guide price oscillations and market battles.
Liquidity Cycles Signal Market Momentum
SOL’s liquidity index reflects recurring cycles of Ignition, Expansion, Exhaustion, and Reset. Surges in liquidity often align with bullish expansions, while sharp declines signal market cooldowns and lower participation.
Historical patterns show Ignition periods near turning points, as observed in May and August. Reset phases coincide with sharp corrections or indecision, allowing liquidity to rebuild before the next move.
These cycles indicate a rhythmic flow of SOL’s market activity. Traders recognize that liquidity resets often precede quieter accumulation phases, setting conditions for fast, opportunistic price movements.
The post SOL Price Builds Momentum as Liquidity Patterns Signal a Potential Breakout Move appears on Crypto Front News. Visit our website to read more interesting articles about cryptocurrency, blockchain technology, and digital assets.

