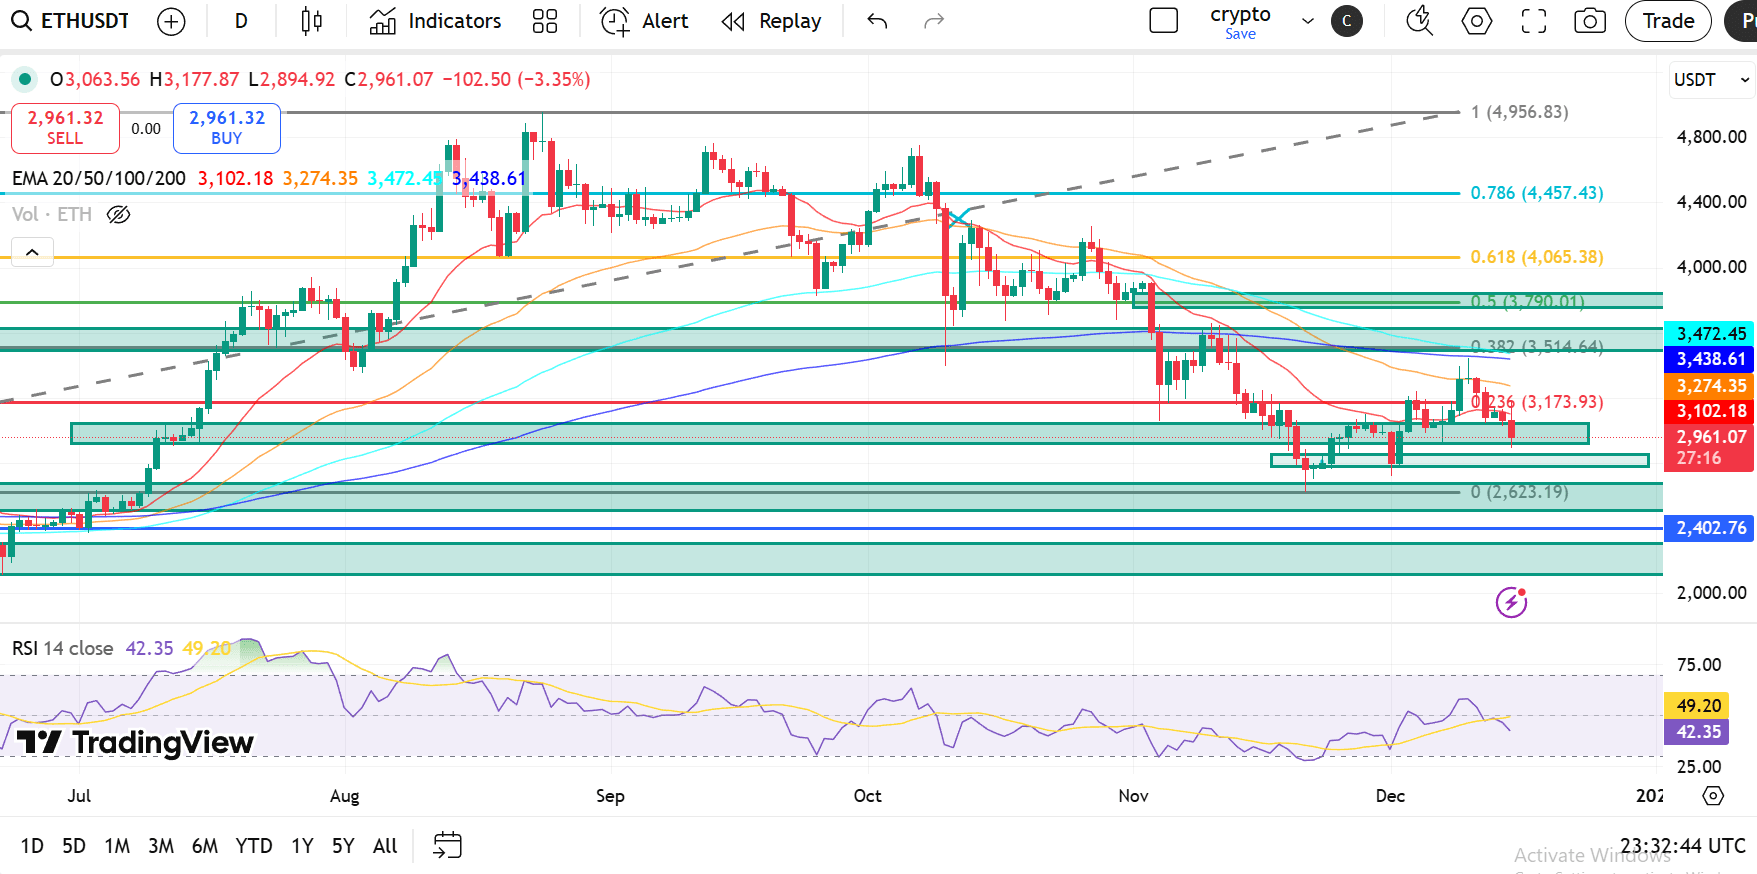
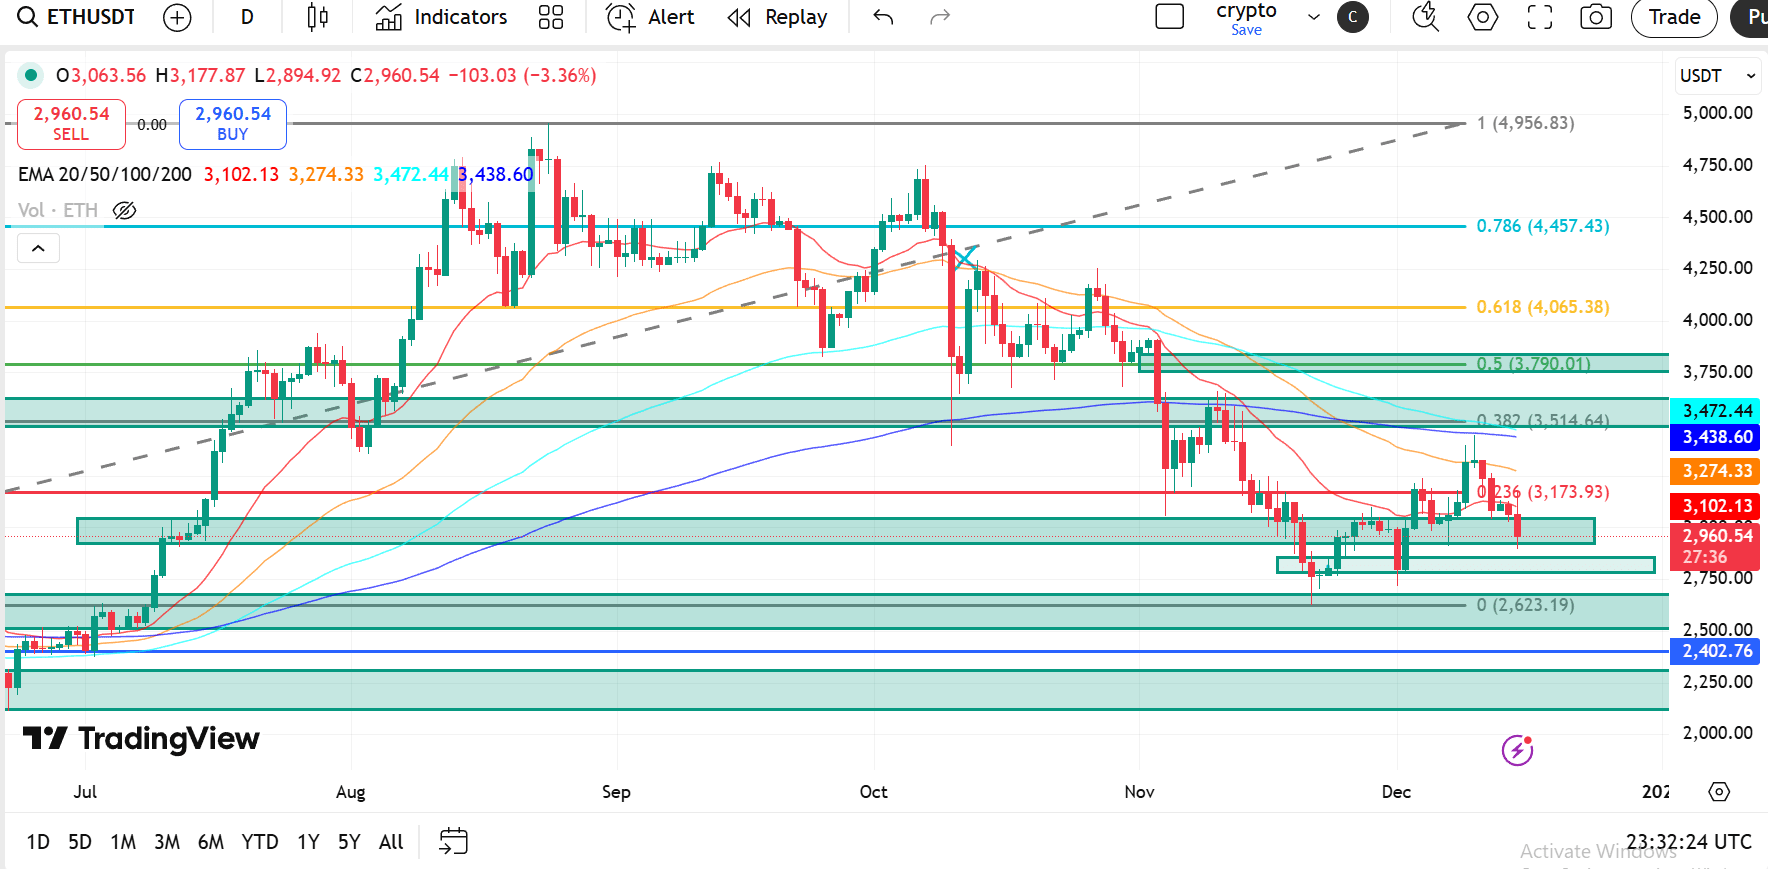
Ethereum is still facing general downward pressure after failing to maintain above the supply area between $4450 and $4950, where the price encountered repeated rejection near the 0.786 Fibonacci level and previous peaks. This rejection was a clear sign of a trend reversal and initiated a prolonged corrective phase.
The downward movement accelerated as soon as ETH lost the area between $4065 and $3900 (0.618–0.5 Fib), confirming a structural breakdown and pushing the price back into a lower demand range.
Moving Averages Structure (bearish bias)
ETH is currently trading below all major moving averages, with downward sloping averages acting as strong dynamic resistance:
20 EMA – 3,102 USD
50 EMA – 3,274 USD
100 EMA – 3,472 USD
200 EMA – 3,438 USD
The overlay pressure on the moving averages above suggests limited upside unless ETH can reclaim the area between 3,275 USD and 3,450 USD decisively.
The price is now consolidating within a major demand zone between 2,950 USD and 3,050 USD, which closely aligns with the 0.236 Fibonacci level ($3,173), where it has been tested repeatedly. This area has absorbed selling pressure so far, indicating short-term stability.
For the bullish continuation, ETH must first reclaim 3,173 USD (0.236 Fib), then break above 3,514 USD (0.382 Fib). A stronger recovery requires acceptance above 3,790–3,900 USD (0.5 Fib), where previous support turned into resistance.
On the bearish side, a clear breakdown below 2,950 USD would expose ETH to further demand around 2,620 USD (Fib 0), which is the next major support visible on the chart.
The RSI indicator is currently close to 42, indicating weak momentum, but it also suggests that ETH is not extreme in the downturn — which aligns with a consolidation phase rather than aggressive selling.
📊 Key Levels
Resistance
3,102 USD (20 EMA)
3,274 USD (50 EMA)
3,472–3,438 USD (100 & 200 EMA)
3,173 USD (0.236 Fib)
3,514 USD (0.382 Fib)
3,790–3,900 USD (0.5 Fib)
4,065 USD (0.618 Fib)
Support
3,050–2,950 USD (major demand zone)
2,623 USD (Fib 0)
2,402 USD (extended bearish support)
RSI Indicator
42.33 — Neutral to bearish, stable
📌 Summary
ETH is defending the critical demand area after a sharp correction, but the broader trend remains bearish as long as the price stays below the resistance range between 3,275 USD and 3,500 USD. A temporary rebound may occur; however, a trend reversal requires strong acceptance above 3,800 USD+. Losing 2,950 USD would open the door for further declines towards 2,620 USD.