
I find this chart quite noteworthy, so I'm sharing a quick perspective on the spot demand of $BTC at the current time.

During this cycle, BTC has experienced 3 clearly defined waves of significant demand. Each time the spot demand surged, the price also showed corresponding upward movements. However, if you look closely at the right side of the chart, the most recent wave of demand is showing signs of stagnation.
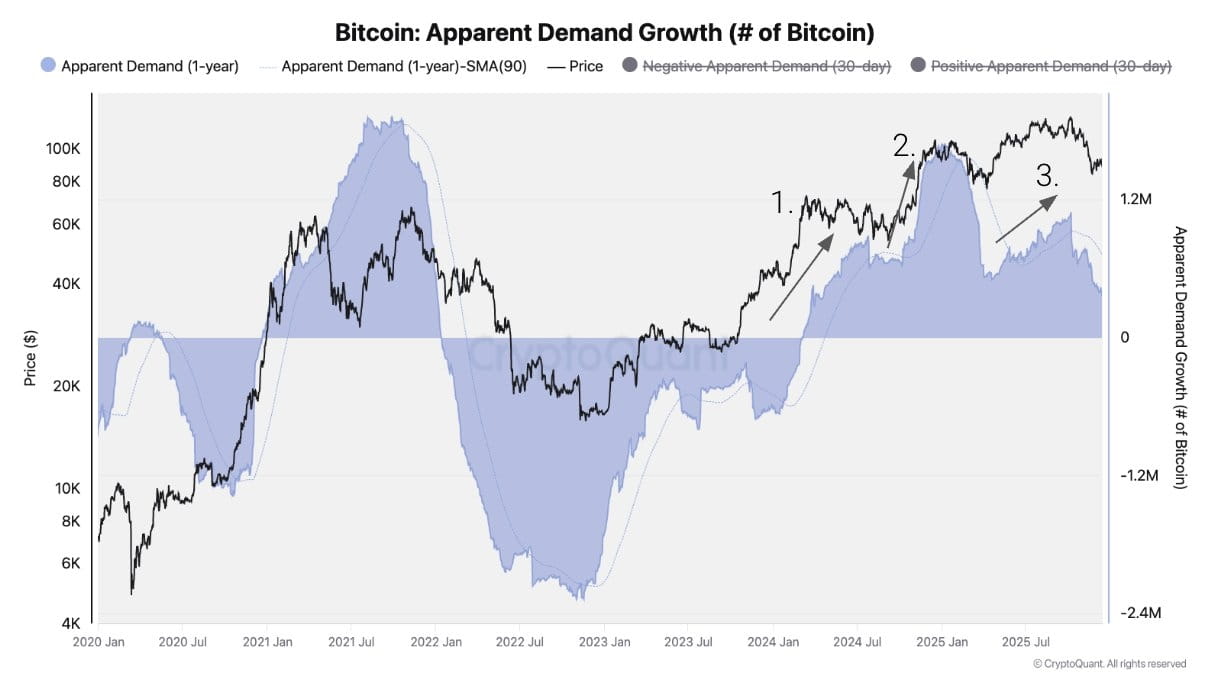
Since the beginning of October, the actual spot demand (apparent demand) has continuously been below the trend line, meaning that the real buying capital entering the market is not as strong as before. The price remains relatively stable, but it is lacking a new push from buyers.
Here’s how I simply understand it for newcomers:
Prices may still move sideways or bounce back in the short term due to news, ETFs, or sentiment.
But if spot demand does not return strongly, it will be very difficult for BTC to have a sustainable and decisive increase.
This does not mean that the market is about to collapse, but that the probability of sideways movements, fluctuations, or slight adjustments is higher compared to the previous strong buying phase. To continue the upward trend, the market needs an additional wave of new buying, which could come from larger capital flows, macroeconomic stories, or a strong enough catalyst.
You should look at this chart as a reminder: currently, it is not the phase of 'FOMO buying' but rather a time to observe capital flows and manage risks more carefully.
