
I see that this USDT.D chart is being interpreted by many as quite dangerous, so I want to share a little directly with you all.
There are quite a few people here saying that USDT.D rising is bullish for the market. But if you pay close attention, those same people are the ones who shouted 'buy the dip' for BTC at levels much higher than the current price by tens of thousands of dollars.
And the result is something everyone can see.
USDT.D represents the proportion of stablecoins standing outside the market.
USDT.D increases → money is flowing back to stable → risk-off
USDT.D decreases → money returns to the market → risk-on
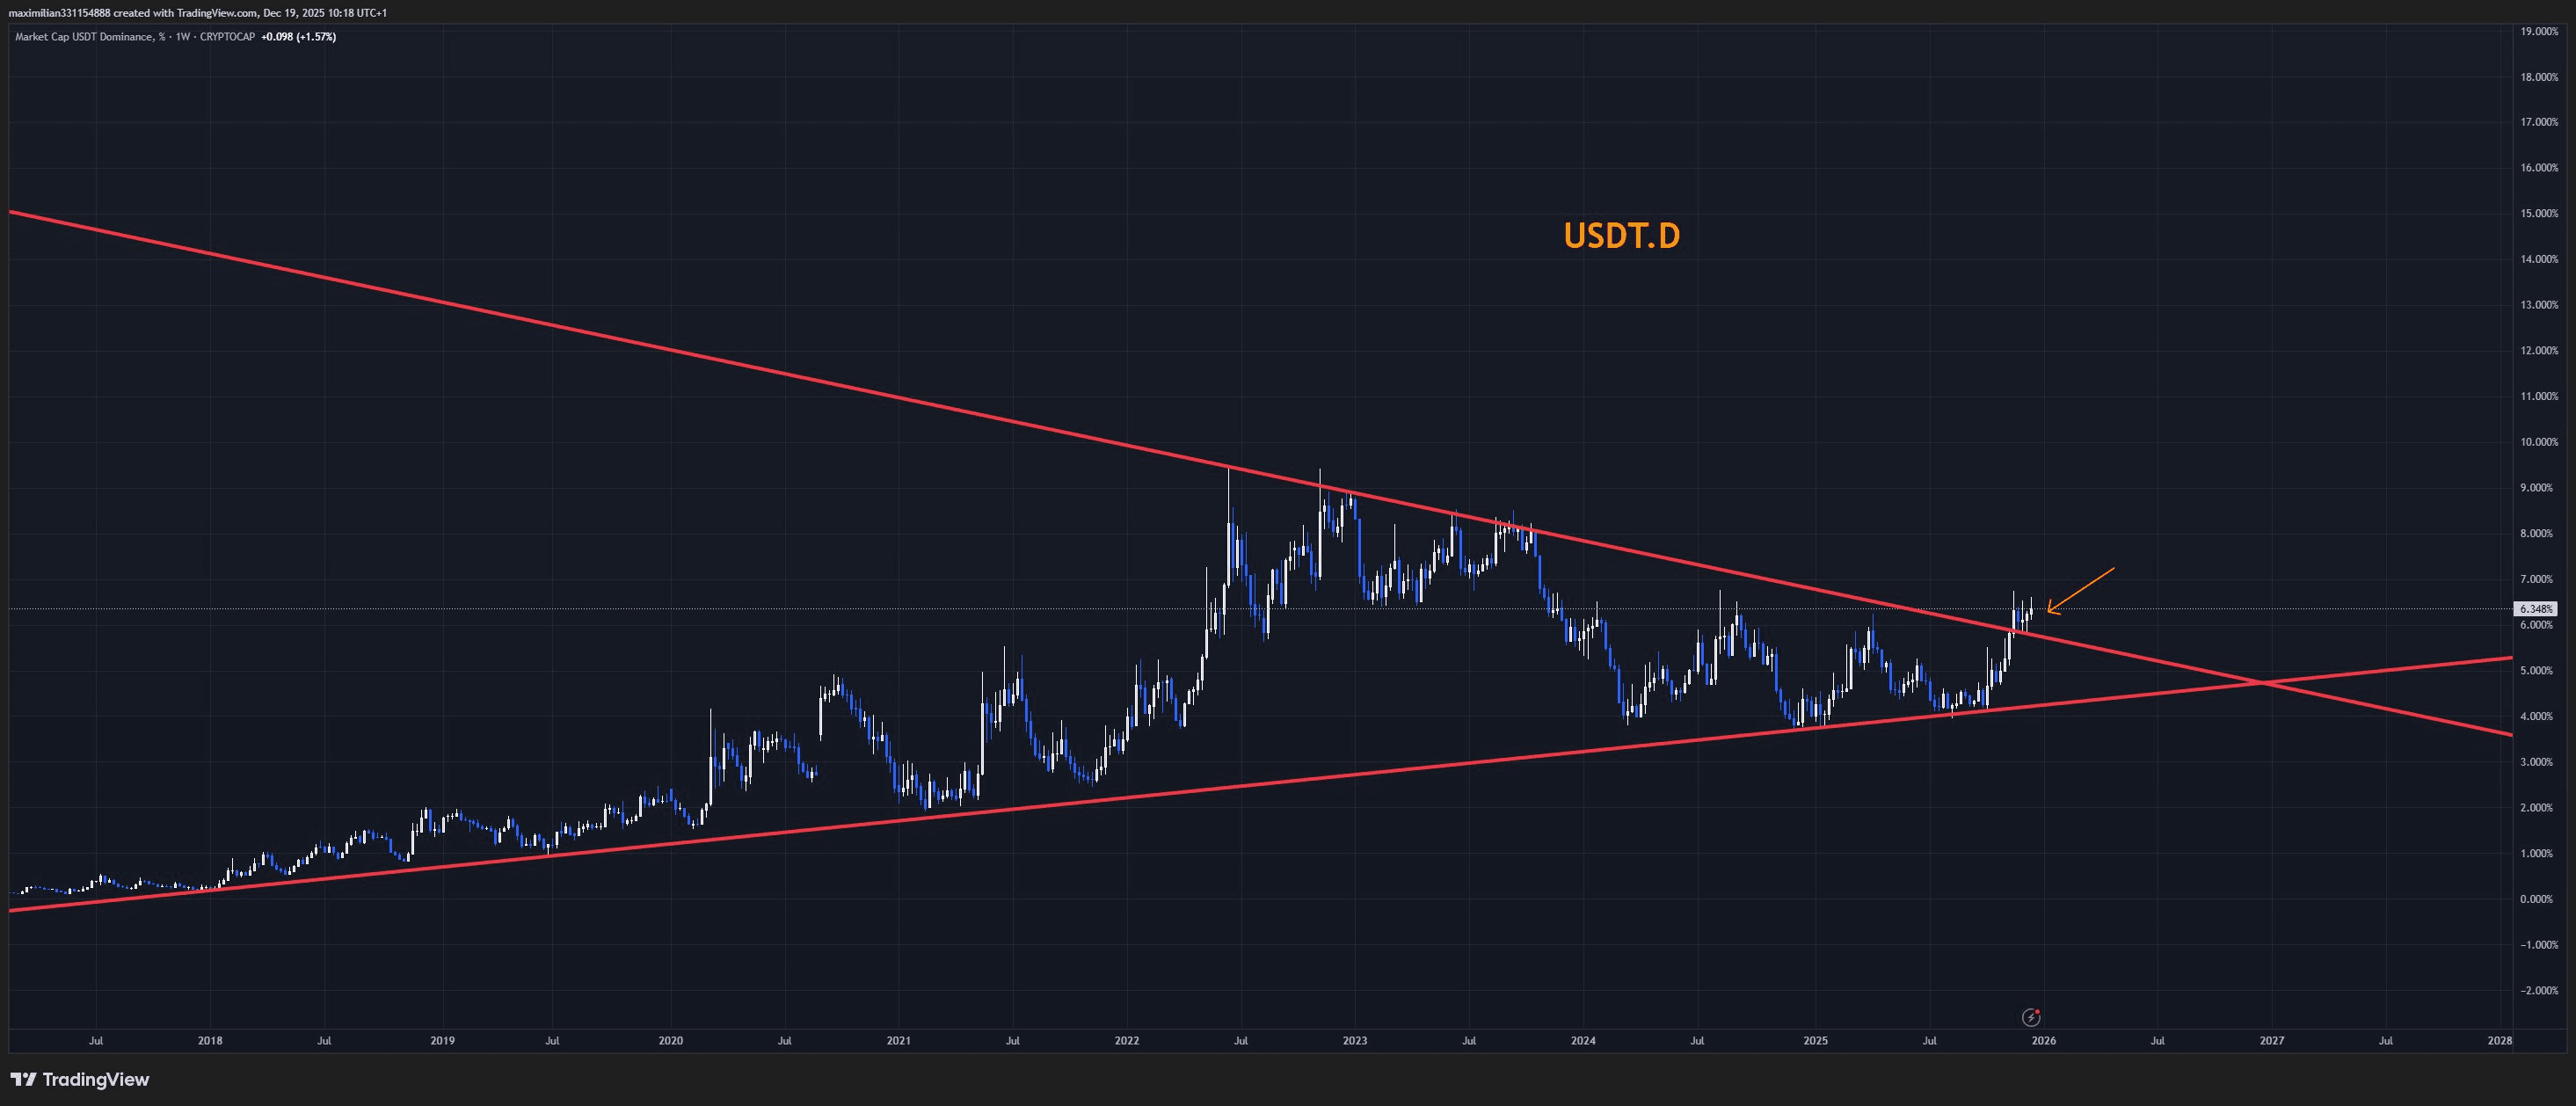
The current chart is a long-term compression (triangle) pattern and the recent bounce is testing the upper trendline, not a clear breakout. In the context of $BTC demand spot being weak, ETF flow fluctuating, and sentiment being unstable, the rise of USDT.D is not a positive signal for altcoins or the market in general.

In my personal view, if USDT.D continues to hold above this level, it means pressure on BTC and altcoins is still present. And at this point, if anyone still tries to label it with a 'bullish' narrative, it's very easy to misinterpret the essence of cash flow.
Brothers at this stage should look at cash flow and market structure, not just each green and red candle. Preserving capital is more important than trying to be right.
