

I am going to show a signal based on RSI but first let's consider the main chart —LAUSDT (Lagrange).
The event is happening now at a strong support level. There have been several attempts to break this support since August without success. The support is still holding. Now that the event is happening nearby; we take this as a buying opportunity. "Buy when prices are low/trading at support." Therefore the above trading numbers.
The chart tends to a flat bottom but also to higher highs. This is the first chart in this post.
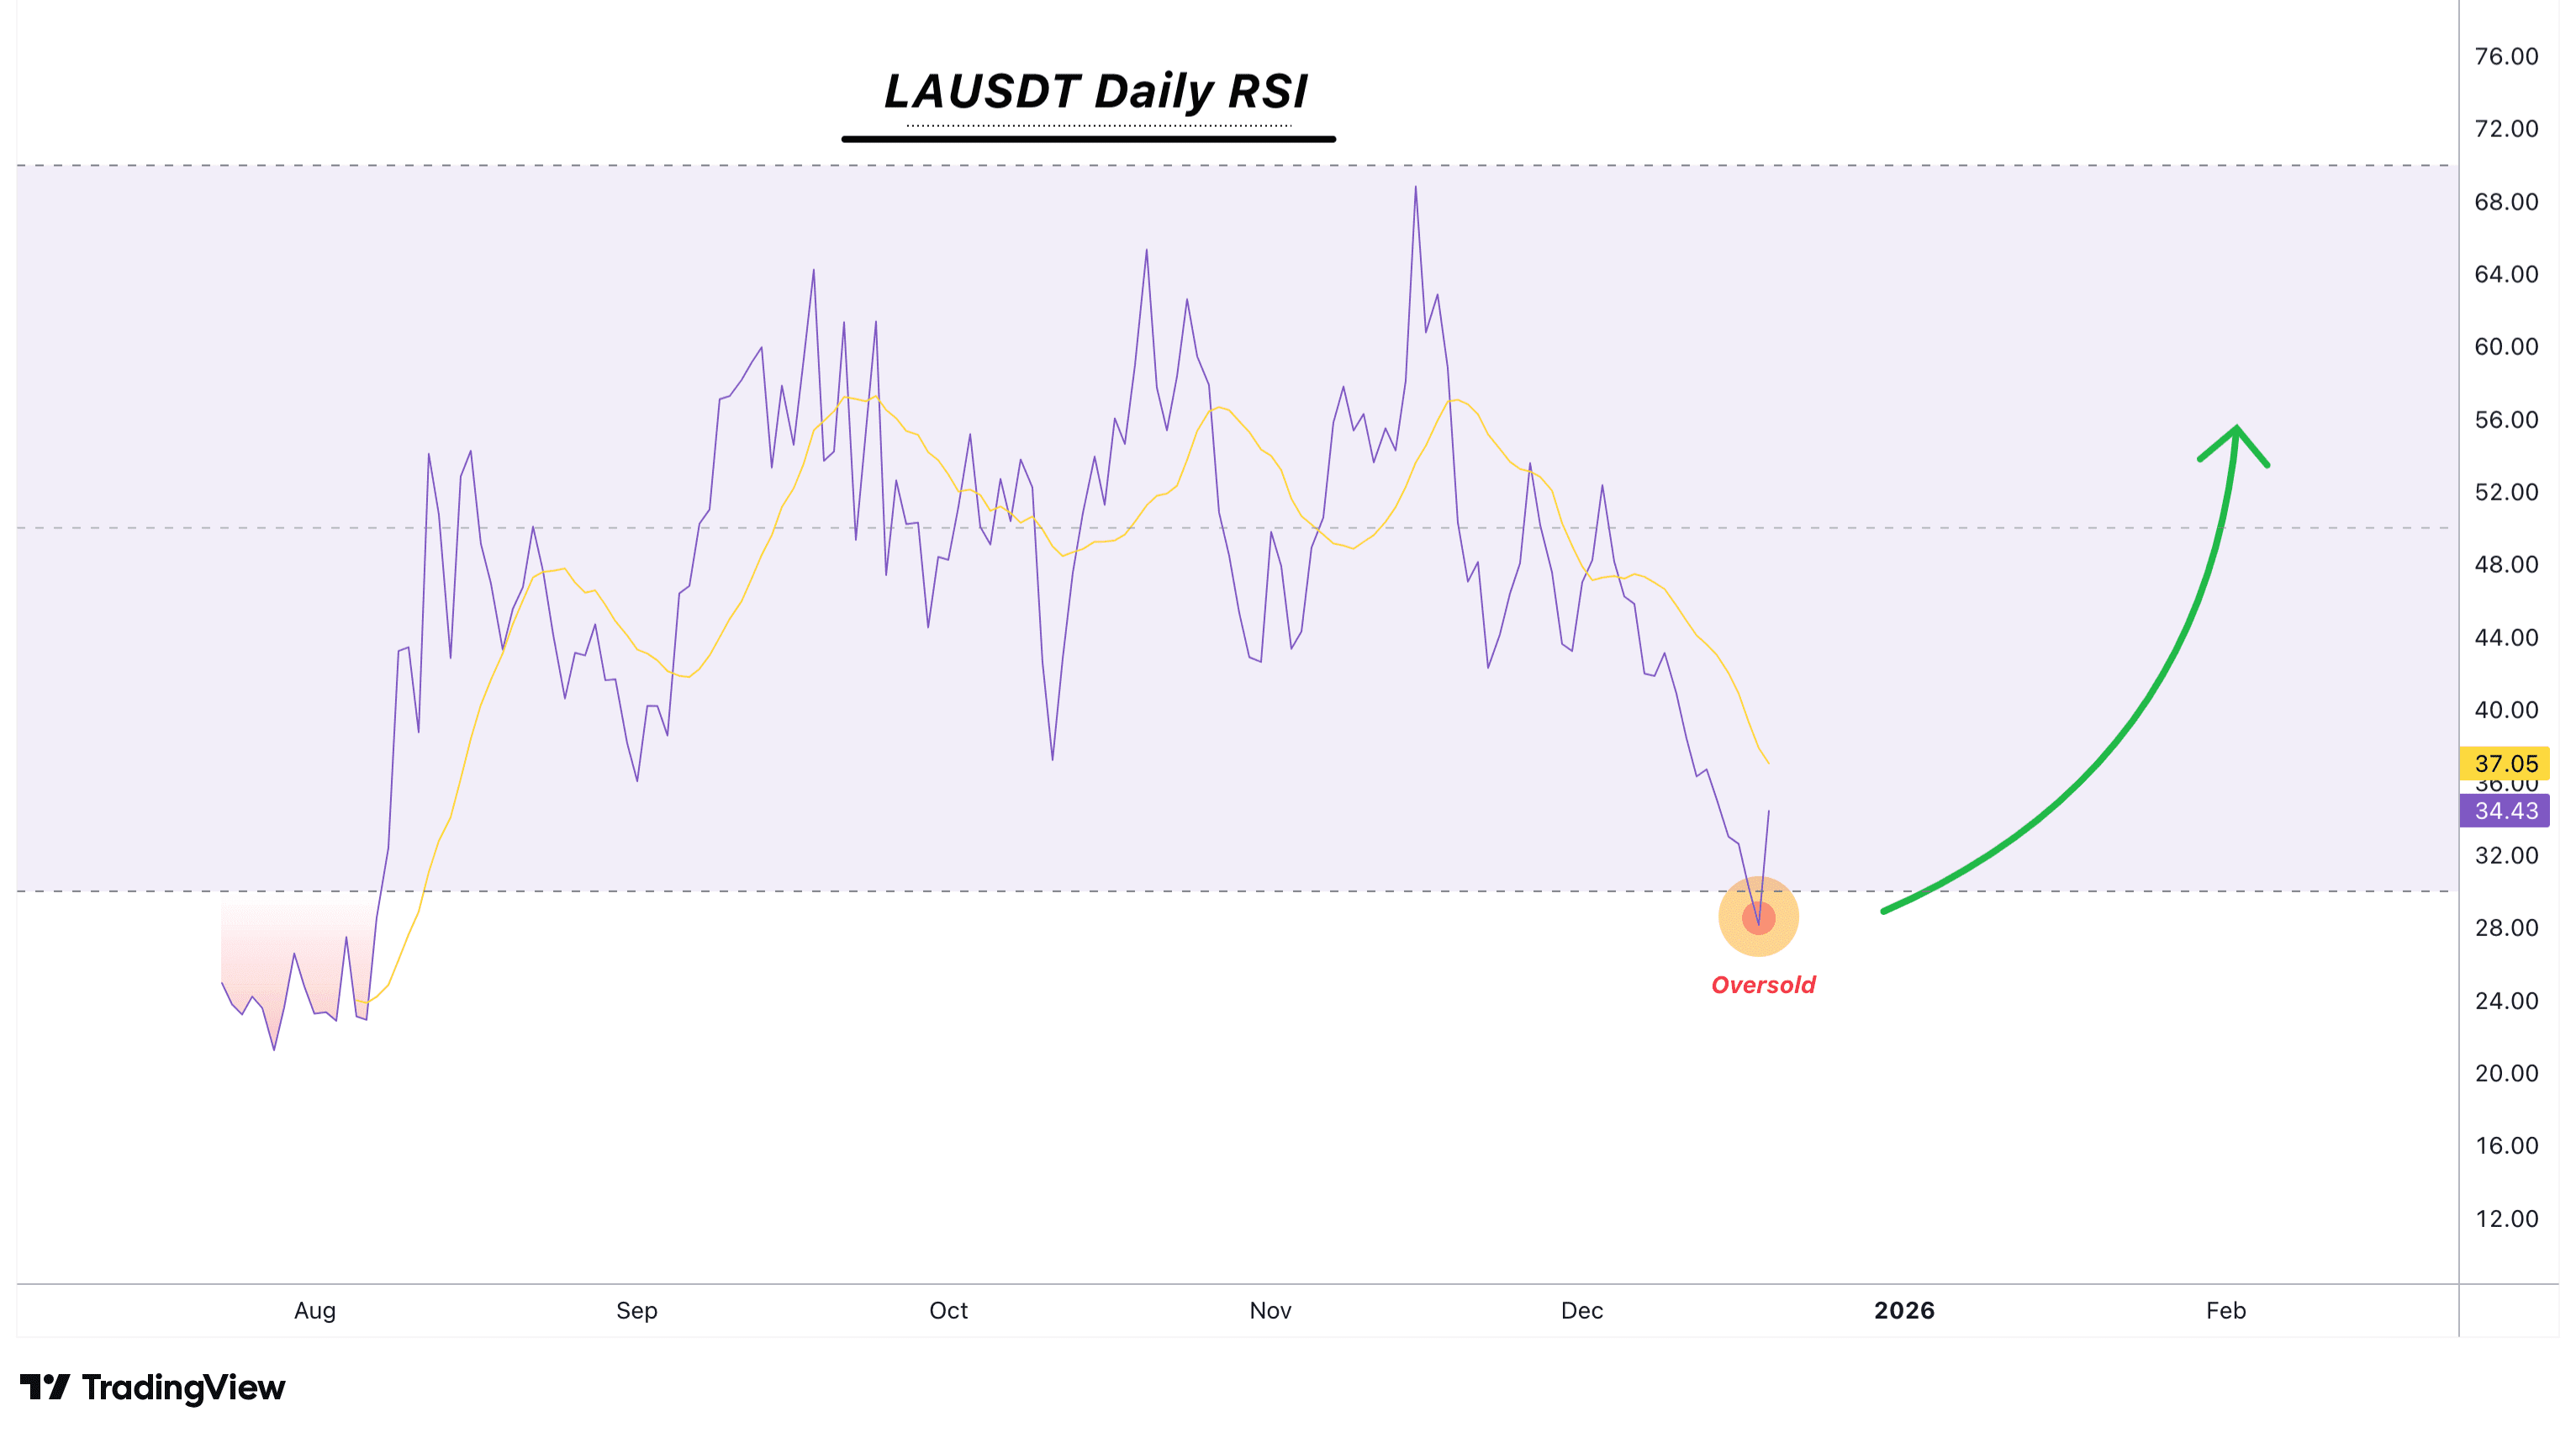
The second chart is the RSI. Here you can see that it has reached its lowest point since this project started trading - oversold. This can easily lead to a trend reversal.
There may be some fluctuations, remember. There may be lower prices before the uptrend appears. All of this is irrelevant. We know that the opposite will happen soon based on these signals, and that's why we buy and hold.
Thank you for reading. I wish you continued success. No matter what happened in the past, know that you are a divine being and will always deserve the best. We all make mistakes. Never give up.
Namaste.
⚠️ Disclaimer:
This analysis is for educational purposes only and does not encourage trading in futures or any prohibited transactions. The aim is to illustrate potential market movement, not a direct recommendation to buy or sell.
💡 Important Notes:
- This analysis is for educational purposes only.
- Please study the market and make decisions based on your ability and risk tolerance.
- The author is not responsible for the trading of others or their profit results.
✅ Trade here on $LA