Brothers, I am Mig
Just now I was staring at the 4-hour chart of ZEC for a long time, and my heart skipped a beat. The price is stuck around 405, unable to go up or down, isn't it frustrating? I know many people are feeling anxious and shaky right now, don't worry, Mig will break down this situation for you in plain language.
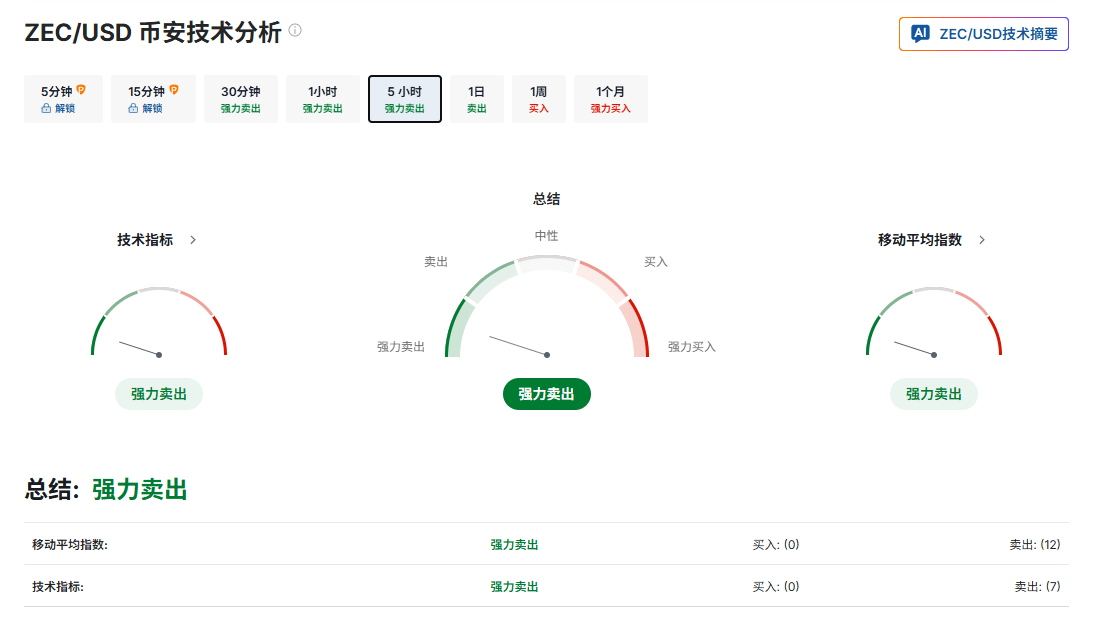
Technically speaking, why do we say 'strong sell' is not just a joke?
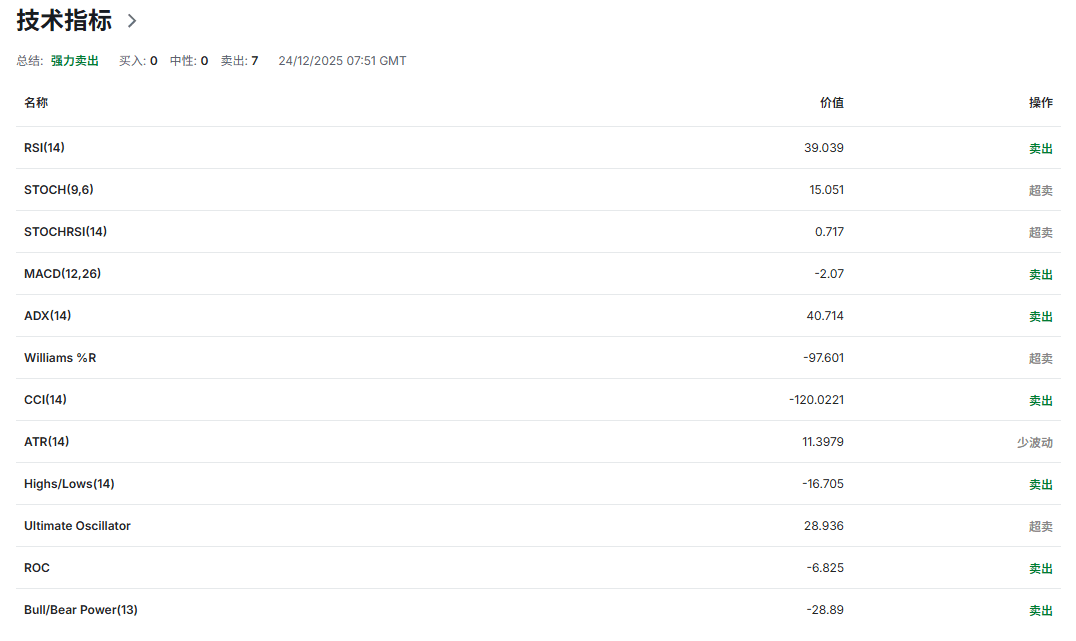
Look at that table, 7 sell signals, 0 buy signals, this is not an adjustment, this is a bear market crush.
RSI(14) is at 39: This number is quite sneaky, below 50 is weak, but it's still a bit far from 30, the 'extreme oversold' level, indicating there is still room for decline, it hasn't fully dropped.
MACD is below the zero axis, value -2.07: this is not a simple dead cross, this is the yellow and white lines diving deeper underwater, bearish momentum is still strengthening, and a rebound is unlikely to reverse directly.
The most critical point is that ADX(14) is as high as 40.7! This number exceeds 40, indicating that the current downtrend is very strong and directional, not a fluctuation, but a one-sided trend. Other oversold indicators are likely to fail in the face of a strong trend, and rebounds will be very short-lived.
Mig's summary: The technical aspect is not a single indicator shouting 'sell,' but a group of indicators along with trend strength indicators all shouting 'trend down, do not catch falling knives.' Just looking at oversold to catch the bottom? You might catch it halfway up the mountain. Want to understand how these indicators work together to 'speak'? Follow Mig, I will teach you how to see through these 'technical traps' step by step in the village.Chat Room
My core view: Today’s surge? The dream should wake up.
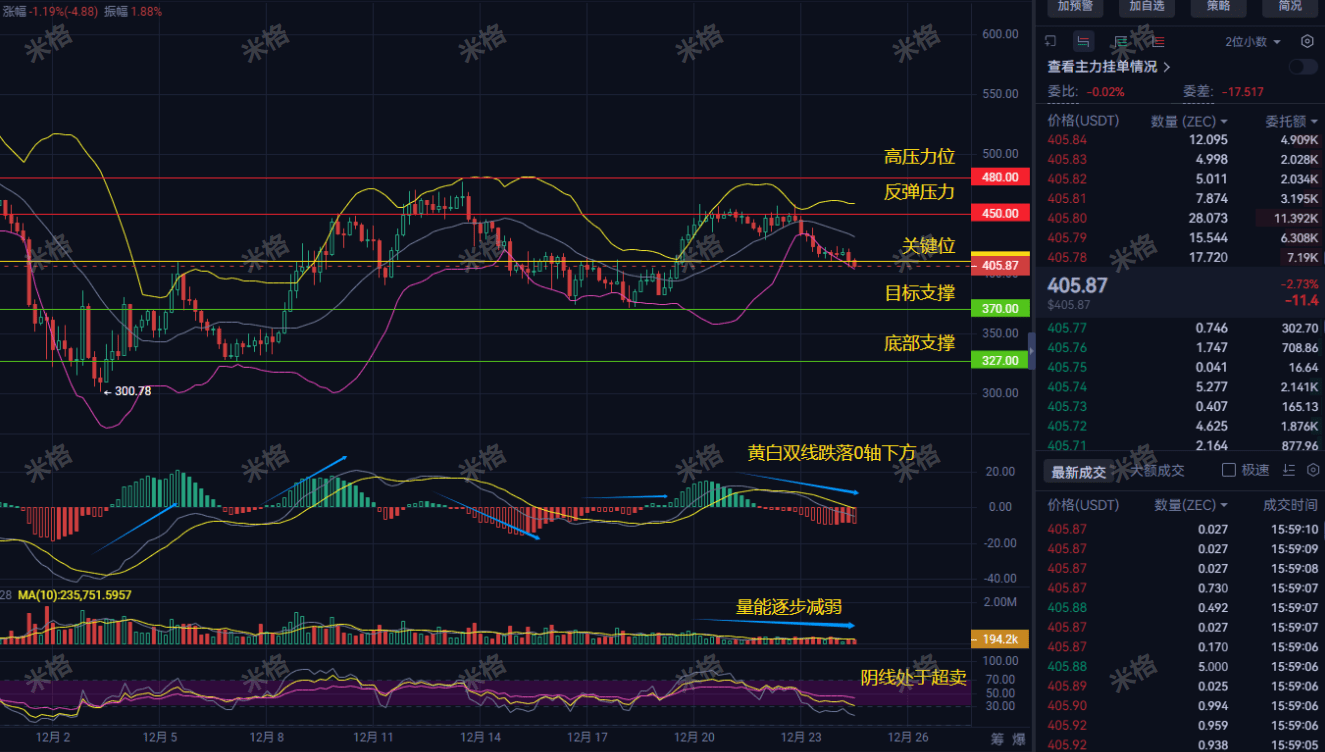
Looking at that chart, the price is tightly pressed by all moving averages, this is called 'bearish alignment,' each line is a checkpoint for rebounds. Above 480? 450? Layer upon layer is a trap, whenever it rises, someone wants to run.
Current price 405.87, below the key level of 410, the real defense line below, first look at 370, second look at 327. My judgment is that today there is a high probability of testing the first defense line 370, whether it can hold depends on whether the bears give breathing room.
Mig's summary: When the big trend is down, all rebounds are opportunities for you to reduce positions and escape, not a trumpet for adding positions. I know some people are unconvinced, thinking a V-shaped reversal is possible, but data does not lie. If you always feel like you are going against the market, follow Mig for the latest point layout analysis plan.Chat Room
Operational advice for retail investors
For those with empty/ light positions: wait for a strong signal with volume that firmly stands at 420 to discuss.
For those already trapped: take advantage of any rebound to the 415-420 area to decisively reduce positions; if it falls below 390 without a rebound, consider stopping losses.
For skilled traders looking to rebound: around 370, you can try with a small position, with a stop loss.
Market analysis is 'planning,' but the market is 'practical action.' If you always feel one step behind the market, always 'buying drops and selling rises,' then I tell you, you are not lacking analysis, you are lacking a professional guide who can remind you in real time that 'opportunity is coming' and 'run fast.'
Want to know how I, Mig, led the brothers in the village to avoid spikes and accurately ambush? Follow Mig and participate in every attack of Mig's villagers! Mig will announce specific entry times and real-time news in the village every day!

