Brothers, the market is being watched by the master all day, and the hourly chart of ZEC is making my palms sweat. In the morning, it was still said that the bears were strengthening control, dropping 5% to 410, and now the hourly chart closed at 412.89, up 0.84%, but is this really a rebound signal? Don't rush, let me break it down for you slowly.
1. First, let's look at the news: the news is optimistic, so why is it still dropping?
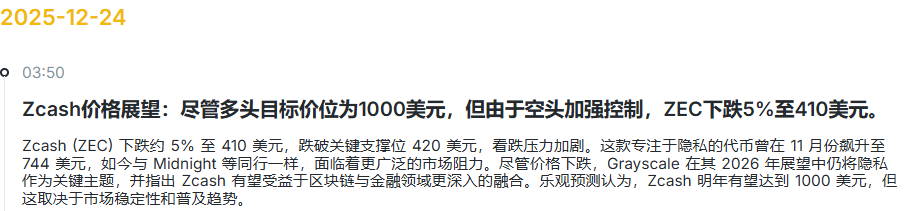
On the news front, grayscale is naming the privacy track, and Zcash is listed as a core asset for 2026, targeting $1000! But just at this moment, the price has instead broken below key support. What does this indicate? The big players don't want you to get in easily! They are using panic to create a golden pit, completely clearing out the last batch of indecisive retail investors.
Think about the madness when ZEC surged to 744 in November; everyone was shouting 'privacy is the future.' Now that the market has cooled down, how many people are starting to doubt life? But those who truly understand have quietly positioned themselves—because real opportunities always appear when most people are in despair.
My opinion:
You are analyzing the technical aspects, while the big players are analyzing your psychology; you are waiting for good news, and the big players use that news to offload before buying back in. The more retail investors believe in 'logic', the easier it is to fall into traps!
2. Let's look at the technicals again: ZEC hourly chart
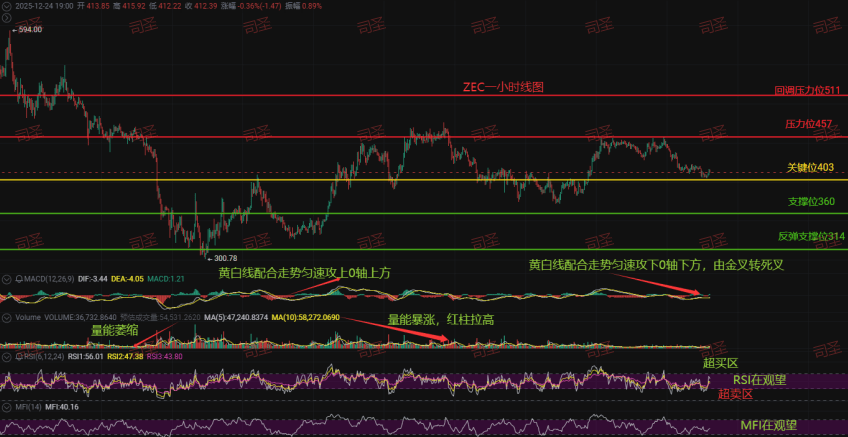
From the chart, ZEC is still in an overall upward trend. The MACD yellow and white lines have dropped below the 0 axis. Although there is a hint of a golden cross, the volume is shrinking, indicating that the bulls are not exerting any effort. There are heavy pressures above; 457 is the first barrier, and 511 is a major resistance level for a pullback. Below? 360 is support, and 314 is the lifeline for a rebound—remember these two numbers; they can save you in critical moments.
I judge that in the short term, it is very likely to test the 457 resistance, but it will be difficult to break through; it is more likely to fluctuate between 403-457. If you want to bet on a rebound, you can try going long with a light position near 360, placing a stop-loss below 314. Remember, it must be a light position! Don't go all in.
3. Sisheng's operational thinking:
If you are currently out of the market: The best strategy is to wait. Wait for the panic sell-off after 403 is broken with volume, wait for a signal of a sharp drop halt in the 375-380 area. Do not act until you reach the ambush zone.
If your current position is trapped: A rebound to around 425 is the last opportunity to reduce your position; don't fantasize about a V-shaped reversal. Lowering costs is the top priority.
If you want to learn: Follow me, because I can turn these cold, hard price points into logical, rehearsed, and responsive trading scripts. Next time, I might tell you how to sniff out the scent of this 'false breakout' 24 hours in advance from 'volume-price divergence' and 'MFI and price divergence.'
Sisheng's opinion: Overall, it's an upward trend, but it still depends on tonight's US stocks and the unemployment claims at 9:30!!!
If you don't know the specific entry and exit points, and for those holding positions, you can follow Sisheng, who will announce the daily coins and entry and exit points in Sisheng Village 24 hours a day.