[AI Investment Research] Three historical silver surges! Where should we go from here?
By analyzing the three historical silver surges through AI, we provide reference and direction for our investments. Not investment advice, DYOR.
Analysis of the historical background of the silver surge in 1979
The silver surge in 1979 is one of the most famous precious metal bubble events in history, primarily driven by speculative manipulation and macroeconomic factors. The key figures in this event were the American oil tycoons, the Hunt brothers (Nelson Bunker Hunt and William Herbert Hunt), who began to hoard silver on a large scale in the late 1970s in an attempt to monopolize the market.
Causes and process: In early 1979, silver prices were only about $6/oz. At that time, the U.S. economy faced high inflation (stagflation due to the oil crisis of the 1970s), and geopolitical tensions (such as the Iranian revolution and the Soviet invasion of Afghanistan) led investors to seek safe-haven assets. The Hunt brothers viewed silver as an opportunity, controlling about 70% of the global silver supply through futures contracts and physical stockpiling. By the end of 1979, they held silver valued at approximately $4.5 billion, pushing prices from $6 at the beginning of the year to nearly $50/oz by January 1980. This surge was not purely market-driven but rather due to an artificial shortage: the Hunt brothers' buying led to tightened supplies, attracting more speculators and creating a bubble.
Key factors:
Inflation and currency devaluation: The dollar was weak in the 1970s, prompting investors to turn to hard assets for safety.
Industrial demand: Silver was used in photography, electronics, and other industries, but speculation far exceeded actual demand.
Lack of regulation: Loose rules in the futures market allowed leveraged positions to amplify price increases.
Peak and crash: On January 18, 1980, prices hit a peak of $49.45/oz. However, the Chicago Mercantile Exchange (COMEX) subsequently raised margin requirements, preventing the Hunt brothers from adding funds. On March 27, 1980 ("Silver Thursday"), prices crashed from $21 to $10.80, resulting in the Hunt brothers' bankruptcy and the market evaporating billions.
This event exposed the risks of speculative manipulation, leading to stricter regulation in the futures market, such as position limits. The surge lasted about 1 year, with the turning point sharply declining under regulatory intervention.
Analysis of the historical context of the silver surge in 2010
The silver surge in 2010 was closer to a market-driven bull market, influenced by the aftershocks of the global financial crisis and industrial recovery. Unlike the singular manipulation of 1979, this rise resulted from multiple factors resonating, with silver prices rising from about $17/oz at the beginning of the year to $30.63/oz by year-end, a 78% increase, continuing to a peak of $49.82/oz in April 2011.
Causes and process: After the 2008 financial crisis, global economic uncertainty intensified, and the U.S. debt ceiling crisis and European sovereign debt issues heightened safe-haven demand. Silver prices rebounded from lows in 2009, with investment demand skyrocketing in 2010: ETF inflows (such as iShares Silver Trust) reached record levels, and industrial demand rebounded (electronics, solar cells, etc.). By early 2011, prices broke through $40, but the end of the Federal Reserve's quantitative easing (QE2) and signals of economic recovery led to a pullback.
Key factors:
Economic uncertainty: Post-crisis, investors turned to precious metals, with silver attracting retail investors as the "poor man's gold."
Industrial demand rebound: Silver was used in photovoltaics, medical, and automotive industries, with demand rising 21% from the 2009 low.
Investment demand dominance: Net long positions surged, and futures speculation amplified volatility.
Peak and turning point: In April 2011, silver prices peaked at $49.82, then retreated due to expectations of Federal Reserve interest rate hikes and slowing industrial demand, falling to $26 by year-end. The entire cycle lasted about 2 years, with the turning point occurring when policy shifted (end of QE) and supply-demand rebalancing emerged.
Compared to 1979, this cycle appears more sustainable, but is still influenced by macro policies and quickly corrected after surges.
Predictions for silver's upward trend and turning points in 2025-2026
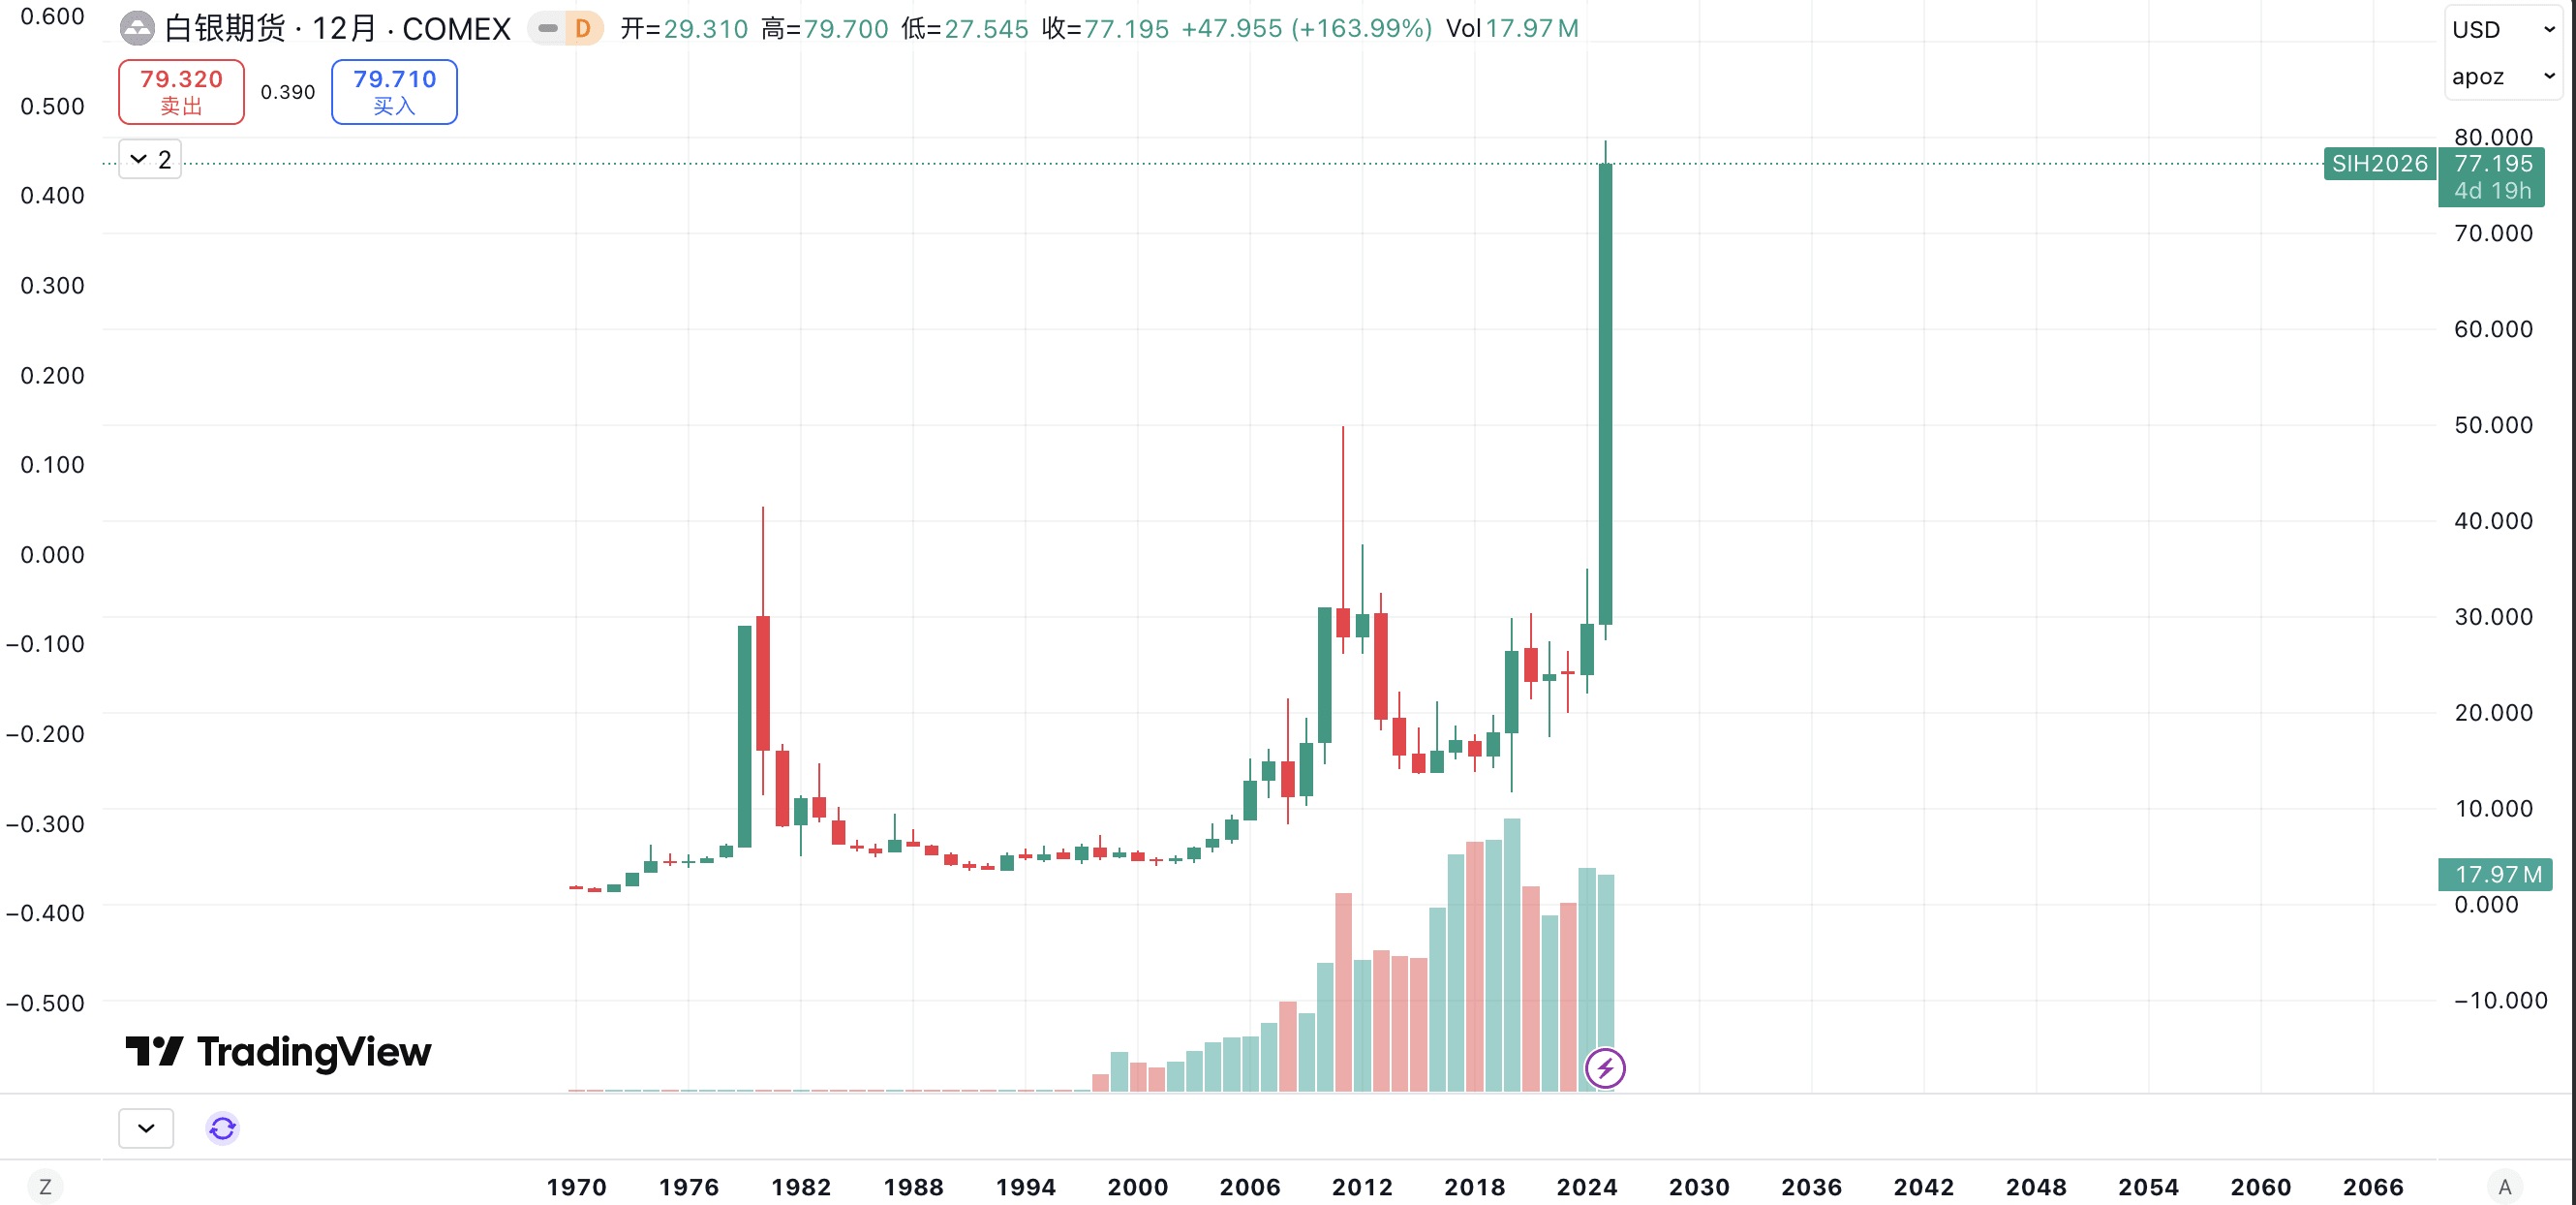
The silver market in 2025 has entered a strong bull market: surging from about $29/oz at the beginning of the year to the current approximately $64, with an increase of over 120%, reaching recent highs. This rise is similar to the industrial-driven + investment frenzy of 2010 but also carries characteristics of the supply shortages seen in 1979. Global silver mine production lags behind demand, with structural deficits widening for the fifth consecutive year (expected deficit of 265 million ounces in 2025), driving prices upward.
Current trends and historical similarities:
Industrial demand dominance (like in 2010): Silver's applications have surged in solar energy (photovoltaics accounting for 40% of demand), electric vehicle batteries, and AI electronics. The global energy transition is accelerating in 2025, with strong demand from China and India, similar to the recovery after the 2010 crisis.
Supply shortages and speculation (like in 1979): Insufficient mineral supply (with major producers like Peru and Mexico experiencing declines), shrinking inventories attracted ETFs and futures speculation. Geopolitical tensions (such as U.S.-China trade tensions and the continuation of the Russia-Ukraine conflict) increased uncertainty, driving safe-haven demand.
Macroeconomic factors: High inflation (though not as severe as in the 1970s, but similar expectations of Federal Reserve easing policies in 2025 akin to the QE era), a weakening dollar, and the correlation with gold (the gold-silver ratio has decreased from 80:1 to the current approximately 40:1) support the rise. Unlike in the past, this time silver has been categorized as a "strategic mineral" by multiple countries, enhancing long-term demand.
Trend predictions for 2025-2026:
Continuation of the rise: Based on current momentum and analyst consensus, silver prices are expected to fluctuate between $60-80 in 2025, averaging about $75 (CoinCodex predicts $72-77; IG and deVere group estimate $50-65, but considering demand exceeding expectations, it may be higher). In 2026, it may enter a "price discovery" phase, breaking through $80, averaging $56-70 (Bank of America peak at $65; optimists like Robert Kiyosaki predict $75, with Reddit discussions even suggesting $150). The increase will be driven by industrial demand, similar to the 78% annual increase in 2010 but on a larger scale due to a deeper supply deficit.
Potential high point: If demand continues (with photovoltaic installations projected to grow by 20% in 2026), prices may reach $90-100 in the first half of 2026, similar to the bubble peaks of 1979/2011. However, it will not rise indefinitely: history shows that silver prices are highly elastic and susceptible to amplification by leveraged speculation.
Turning point predictions:
Upward turning point: The first quarter of 2026 may accelerate, especially if the Federal Reserve further cuts interest rates or geopolitical events escalate, similar to the peak buying by Hunt in 1979.
Downward turning point: Expected in mid-2026 (late summer or early autumn), similar to the pullback after the end of QE in 2011. Trigger factors include: economic recession reducing industrial demand (if global GDP slows), new mining capacity coming online (expected supply increase of 5-10% in 2026), regulatory interventions (such as futures position limits to prevent a repeat of 1979), or a bear market in gold. In extreme scenarios, if speculative bubbles burst, prices may retract 30-50% from peak levels, falling to $40-50.
Risks and uncertainties: The optimistic assumption is strong demand, but historical lessons (such as the 1980 crash) remind us of speculative risks; if inflation cools or alternative materials arise (like copper replacing silver in certain applications), the turning point may arrive earlier. Overall, this cycle appears more sustainable than in 2010, but we must be alert for manipulation signs reminiscent of 1979 (such as large holders stockpiling).
In summary, silver prices are likely to continue the bull market into 2026, but the turning point depends on macro shifts. Investors should pay attention to industrial data and policy signals to avoid excessive leverage.