Current price: 90,536.54 USD
24-hour change: -2.48% 📉
📈 Probability of increase
Data suggests a moderate probability of increase with caution:
Positive indicators:
Bitcoin broke above the 94,000 USD level in recent days (January 5-6), indicating strong bullish momentum
Positive funding rate (0.883%) reflects bullish sentiment in the market
Buy-to-sell ratio (114.839%) indicates buyer dominance
Recent news about U.S. inflation dropping to 2.7% supports demand for encrypted digital assets
Negative indicators:
The 2.48% decline in the last 24 hours indicates short-term selling pressure
MACD indicator on the daily time frame shows potential negative divergence
RSI on the 15-minute time frame at 54.88 (neutral area)
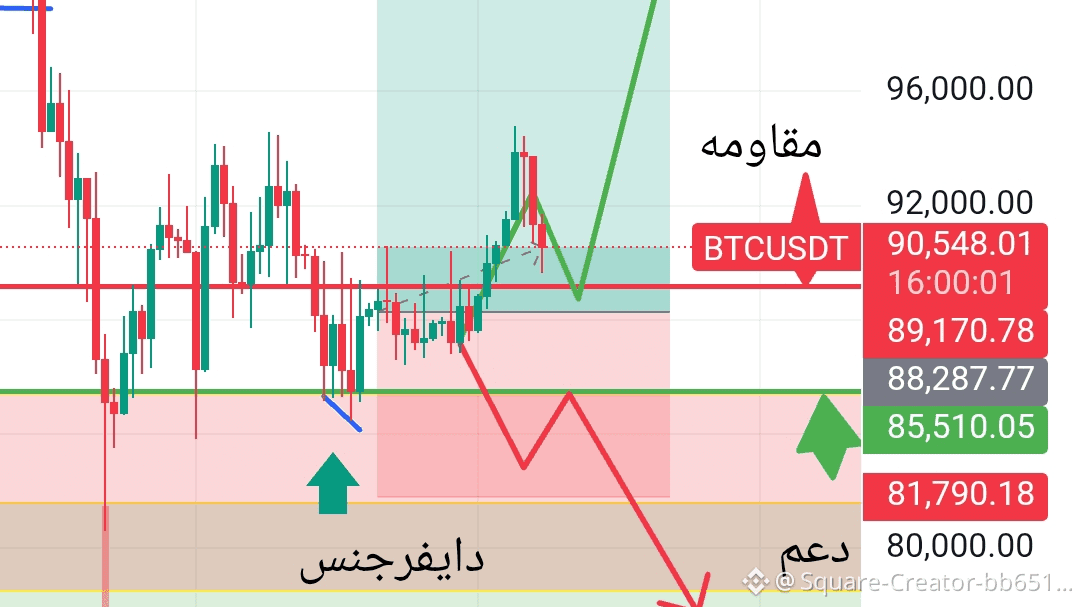
🛡️ Strongest support levels
Key support levels:
First support (short-term): $89,718
Strong technical support level from the 15-minute time frame
Represents a strong accumulation area
Second support: $88,882
Important daily support level
Corresponds to EMA20 moving average
Third support: $87,260
Lowest level on January 1st
Strong psychological support area
🎯 Strongest resistance levels
Key resistance levels:
First resistance (short-term): $91,592
Strong resistance level from the 15-minute time frame
Very close to the current price
Second resistance: $91,002
Important daily resistance level
Corresponds to EMA5 moving average
Third resistance: $94,788
Highest level on January 6th
Strong psychological resistance area
💡 Suggested strategy
For conservative traders:
Buy at support level $89,718 with a target of $91,592
Set stop loss at $88,882
Risk-to-reward ratio: approximately 1:2
Important note:
The market is currently volatile. Risk management is very necessary
Past performance does not indicate future results
Monitoring expected U.S. employment data on Friday may affect the trend
