The price of Dogecoin against the US dollar surged significantly, breaking through $0.1520. Currently, Dogecoin is in a consolidation phase, and if it falls below $0.140, a decline may occur.
DOGE price starts a new round of increase, breaking through $0.1480 and $0.1520.
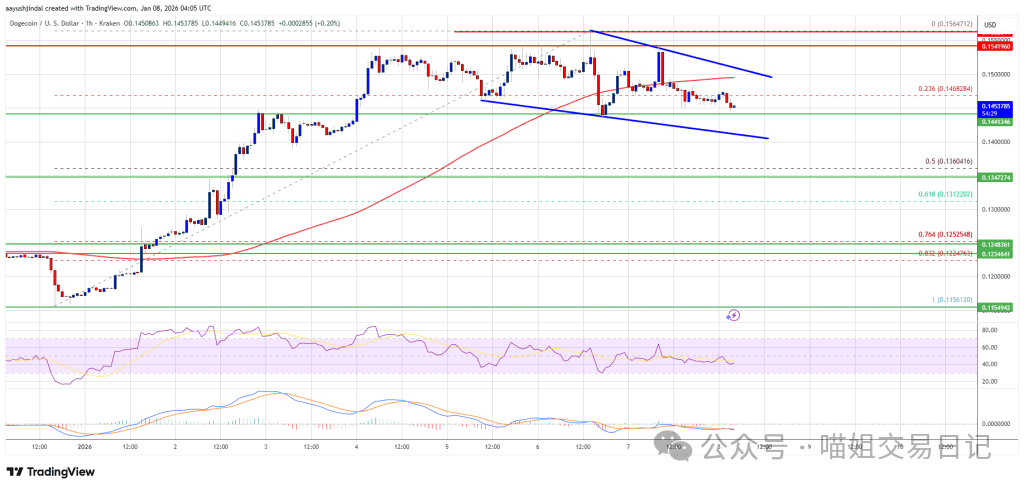
Currently, the price is below the $0.150 level and the 100-hour simple moving average.
On the DOGE/USD hourly chart, a contracting triangle is forming, with resistance at $0.150 (data source: Kraken).
If the price stabilizes above $0.140, it may rise again.
Dogecoin price consolidates its gains
After stabilizing above $0.1420, the price of Dogecoin began a new round of increase, similar to Bitcoin and Ethereum. The price of Dogecoin broke through the resistance level of $0.1450 and entered the bullish zone.
Bulls have successfully pushed the price above $0.150. The price has formed a high near $0.1541 and is currently in a pullback. The price briefly dipped below the 23.6% Fibonacci retracement level of the uptrend from the low of $0.1155 to the high of $0.1541.
The price of Dogecoin is currently below $0.150 and also below the 100-hour simple moving average. Additionally, a converging triangle is forming near $0.150 on the DOGE/USD hourly chart.
If the price continues to rise, the immediate resistance above is around $0.1480. The first major resistance for bulls may be near $0.150. The next major resistance is around $0.1540. If the closing price is above the resistance level of $0.1540, the price could rise further to $0.1625. If the price continues to increase, it may rise further to $0.1680. The next major stop-loss for bulls might be at $0.1720.
Will the downtrend of Dogecoin continue?
If the price of Dogecoin (DOGE) fails to break above $0.150, it may start to pull back. The initial support level is around $0.1450. The next major support level is around $0.140.
The main support level is at $0.1360, which is the 50% Fibonacci retracement level of the uptrend from the low of $0.1155 to the high of $0.1541. If the price falls below the support level of $0.1360, it may decline further. In this case, the price may briefly drop to $0.130 or even $0.1280.
Technical indicators
Hourly MACD indicator — The MACD for DOGE/USD is currently in the bullish zone, but momentum is weakening.
Hourly Relative Strength Index (RSI) – The RSI for DOGE/USD is currently below the 50 level.
Main support levels – $0.1450 and $0.1400.
Main resistance levels – $0.1500 and $0.1540.