Ethereum kicks off this week of January 19, 2026, with nervousness. After a correction that has brought the price to the zone of 3,212 USDT, retail traders wonder if we are facing an institutional discount or the start of a larger decline. While the general sentiment leans towards fear due to macroeconomic factors, on-chain data and market structure tell a story full of nuances.
Let's lift the hood and see what the cold data says.
1. ⚙️ Technical Overview: Structure and Liquidity (Under the Hood)
By analyzing the Market Structure and Heatmaps, we see that the bears have immediate control, but they have encountered a wall.
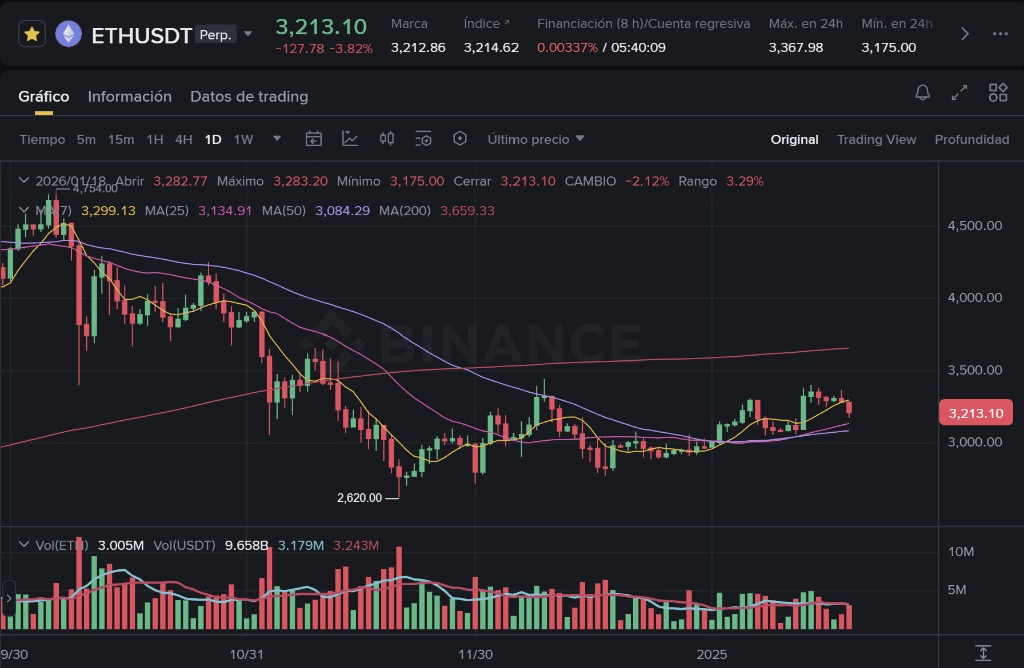
Structure Diagnosis (4H and 1D): The price has lost the 200-period moving average on the 4-hour chart, which technically puts us in corrective territory in the short term. However, the recent drop stopped sharply at 3,175 USDT, a level that coincides with significant volume absorption.
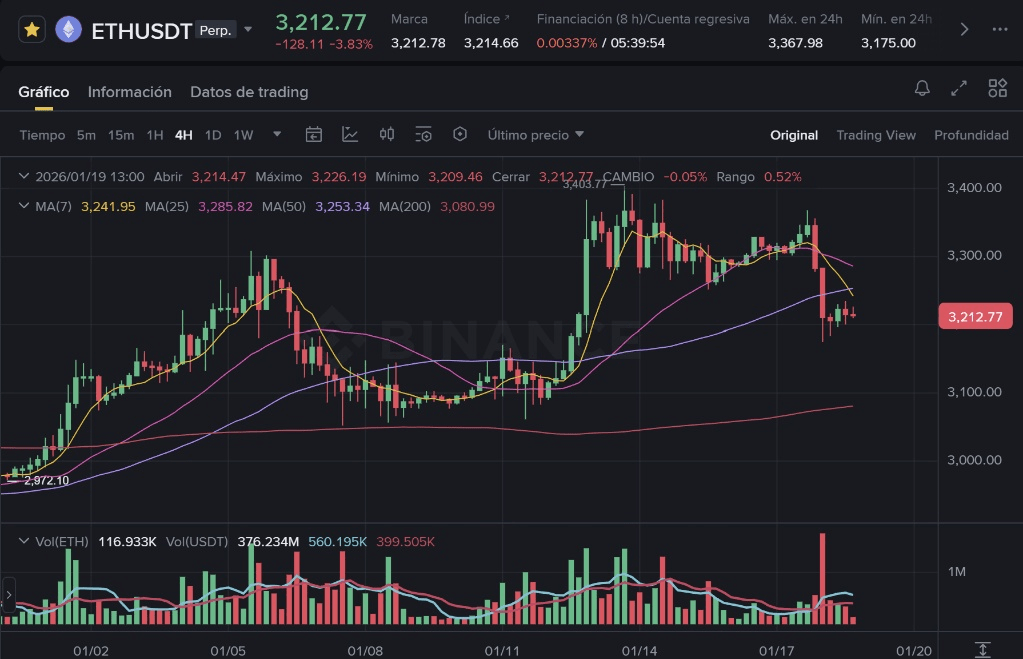
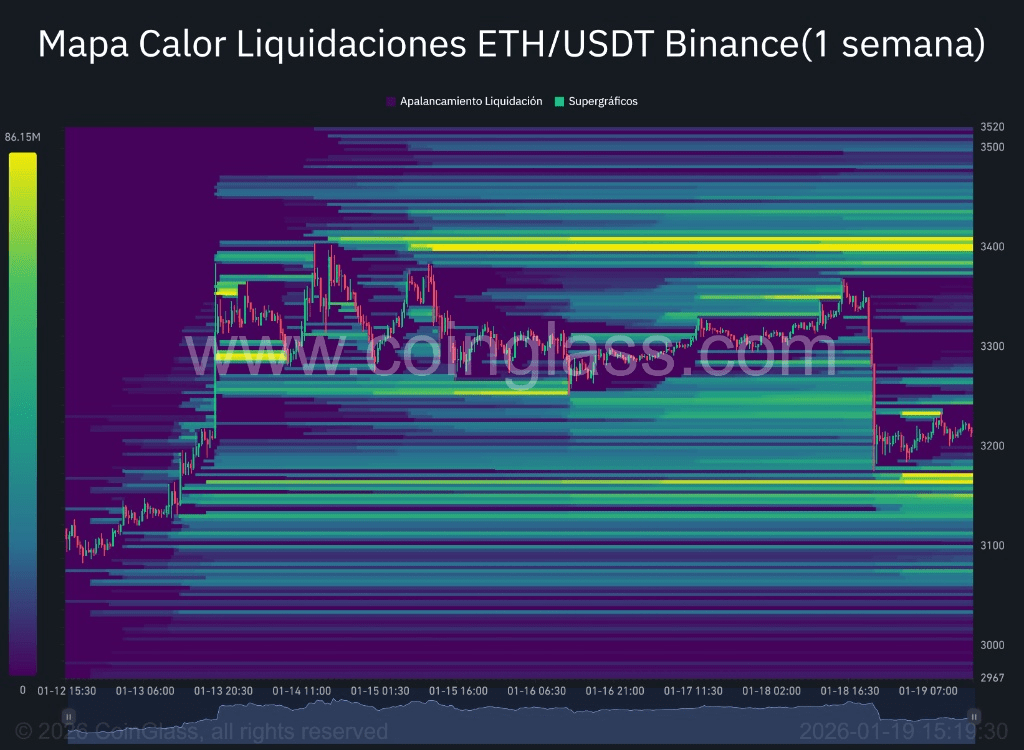
Liquidity and Heatmaps: The heatmap is revealing. We just swept the liquidity of the leveraged "longs" below $3,200. Now, the largest liquidity "magnet" is above, in the $3,380 - $3,420 zone (bright yellow blocks), where the stop-losses of late shorts reside.
Volatility (Bollinger Bands): On the 1H and 4H chart, we saw a "Squeeze" followed by an aggressive bearish break where the price walked along the lower band (Walking the Bands). Currently, the price is trying to re-enter the middle band, which usually indicates a reversion to the mean or, at least, a breather in the drop.
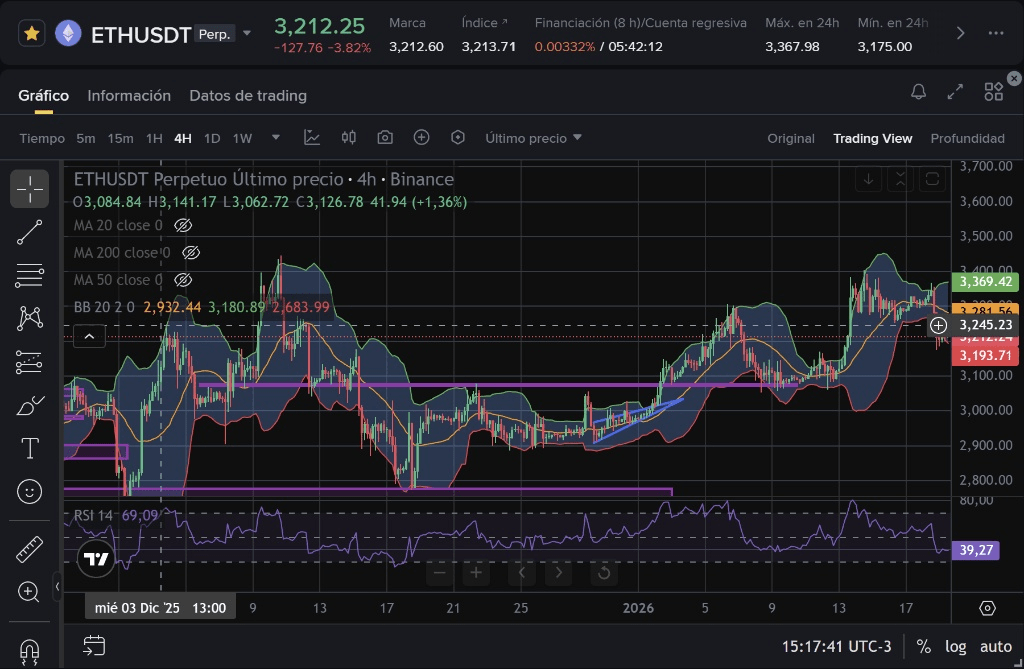
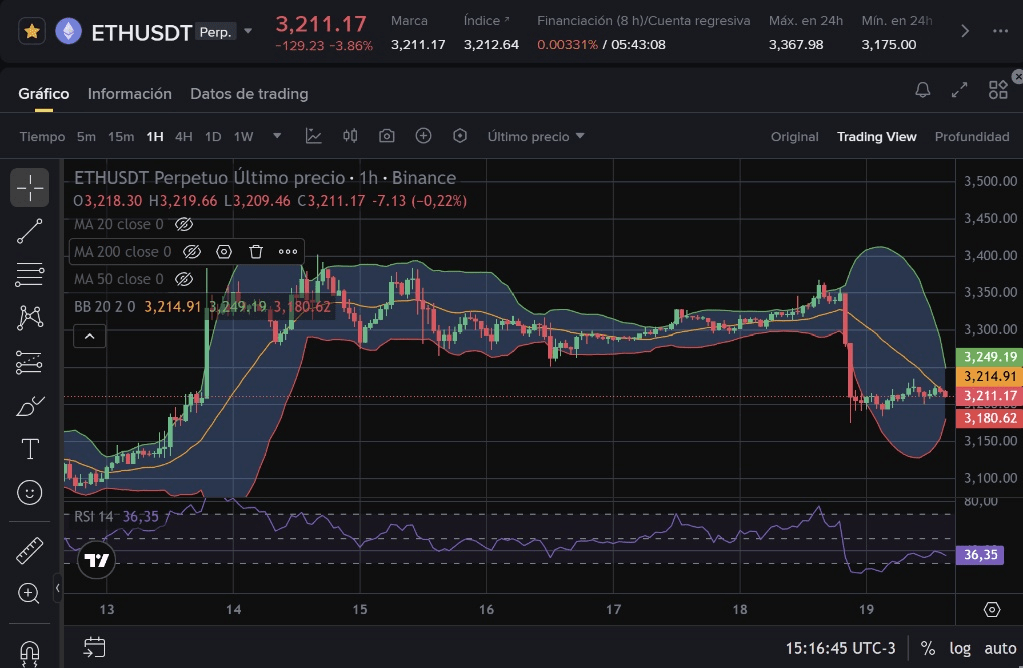
Momentum (RSI): The RSI reached oversold levels (around 30) and is now bouncing towards the neutral zone (44-50), suggesting that the selling pressure is momentarily exhausting.
2. 🌍 Fundamental Context and News
We cannot operate in a bubble. Fundamental analysis, based on recent market reports, shows us an interesting divergence between price and utility:
Headwinds (Macro): The price is being punished by global macroeconomic uncertainty, with investors rotating capital towards safe havens like Gold, which has drained liquidity from risk assets like ETH.
Network Strength (The Silent Truth): Despite the price drop, the Ethereum network is processing a record of 2.89 million daily transactions, and gas fees have decreased, improving actual usability. This is a classic bullish divergence: price drops, usage rises.
Vitalik's Factor: Vitalik Buterin's proposal to simplify the core protocol continues to generate debate, but in the long run, it appears to be a positive catalyst for technical efficiency.
3. 🎯 Probable Market Scenarios
With the price compressed between the need to bounce and macro fear, these are the levels to watch:
🐂 Bullish Scenario (Recovery)
To confirm that the $3,175 bottom is solid, the bulls must recover with volume the 3,250 USDT (Middle Bollinger Band on 4H).
If this happens, a rapid movement towards $3,380 - $3,400 is very likely to hunt the liquidity of the bears exposed in the Heatmap.
🐻 Bearish Scenario (Continuation)
The daily trend remains bearish (below the daily EMA 200 at $3,659).
If the price loses support at 3,175 USDT with a 4H candle closing below, the bounce structure would be invalidated, and we could visit the psychological zone of $3,000 - $3,050.
📅 Expectations for the Week
For this week, the expected climate is Consolidation with High Volatility.
Structure: We are in a "digestion" phase after the strong drop over the weekend. A range between $3,180 and $3,300 is likely.
The Trap: Beware of fakeouts. The market often sweeps both sides before choosing a direction. Given the Heatmap, a "spike" upwards to liquidate shorts before deciding the real trend is a high probability scenario.
Catalyst: If macroeconomic news does not worsen, the technical oversold favors a relief bounce.
💡 Conclusion and Mindset
Ethereum is at a critical decision zone. The network fundamentals are stronger than ever, but the price is a slave to macroeconomic capital flow.
Trader's Advice: Do not try to guess the exact bottom. Wait to see how the price reacts in the $3,250 zone. If you are a long-term holder, the divergence between network usage and price is a signal to study; if you are an intraday trader, strictly respect stops below $3,175.
This content is informative and opinion-based, based on technical analysis and on-chain data. It does not constitute financial advice. The cryptocurrency market is high risk. Do your own research (DYOR).
Do you think ETH will manage to recover to $3,300 this week, or are we heading straight to $3,000? 👇 I look forward to your comments!

#CryptoMarket #Ethereum #ETH #BinanceSquare #TradingAnalysis $ETH