26/01/25 BTC weekly engulfing pattern, the daily line is still in a downward continuation, the upcoming trend is very critical.
The weekly engulfing pattern is accompanied by enormous volume (as seen in comparisons across different exchanges). The MACD histogram is either crossing the zero axis or continuing to grow, with the fast and slow lines showing a trend to continue downward. This current phase is very critical. If we look at the time and space, a pullback to 126,000 for about 3 months is similar to the price at the beginning of 2025. The monthly line still has about a week left to close, and if it forms an inverted hammer line, breaking below the monthly MA20 and failing to recover above 90,500, it will continue to decline.
Ethereum closed with a doji last month, and this month we will observe the trend over the next week. The monthly line also closed below the monthly MA20, with the MACD fast and slow lines crossing downwards, and the histogram returning to the zero axis. In an optimistic scenario, Bitcoin and Ethereum may experience wide fluctuations in their weekly and monthly lines before moving in one direction, similar to what happened after the approval of the gold ETF.
Bitcoin
The monthly line candlestick has broken below MA20. If next month opens below 90500, it will continue to decline, and the decline will not be small. The MACD is showing a bearish trend in the short to medium term, and the weekly MA20 and MA60 have crossed. Closely monitor the weekly MACD histogram and the fast and slow lines for increasing downside risk if they continue to move down.
The daily line has broken below the lower edge of the ascending triangle and rebounded without recovering internally. The recent support is 87000; if it goes lower, it will be 84500. Looking at the 4-hour chart, a small rebound will only be valid as long as it does not break and stabilize above 92000; otherwise, the monthly line cannot close above 90500.
Support: 80600 to 84500 to 87000
Resistance: 92000 to 94500 to 98000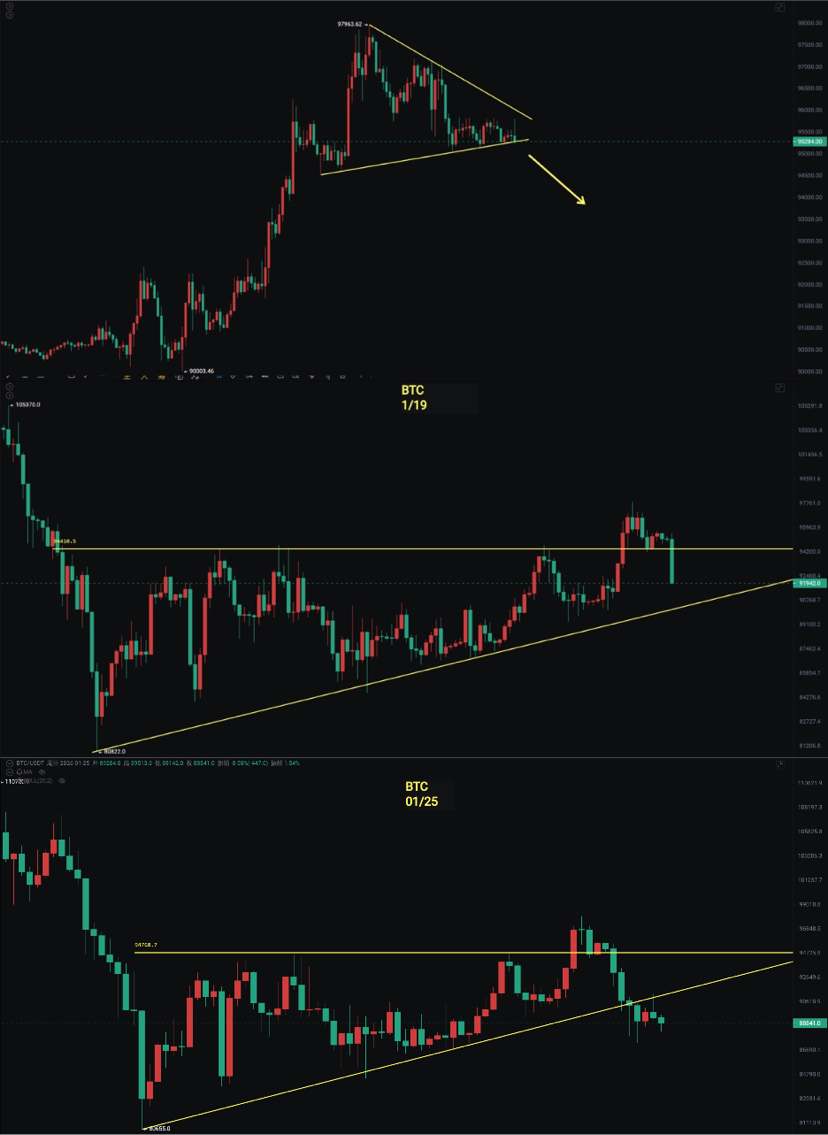
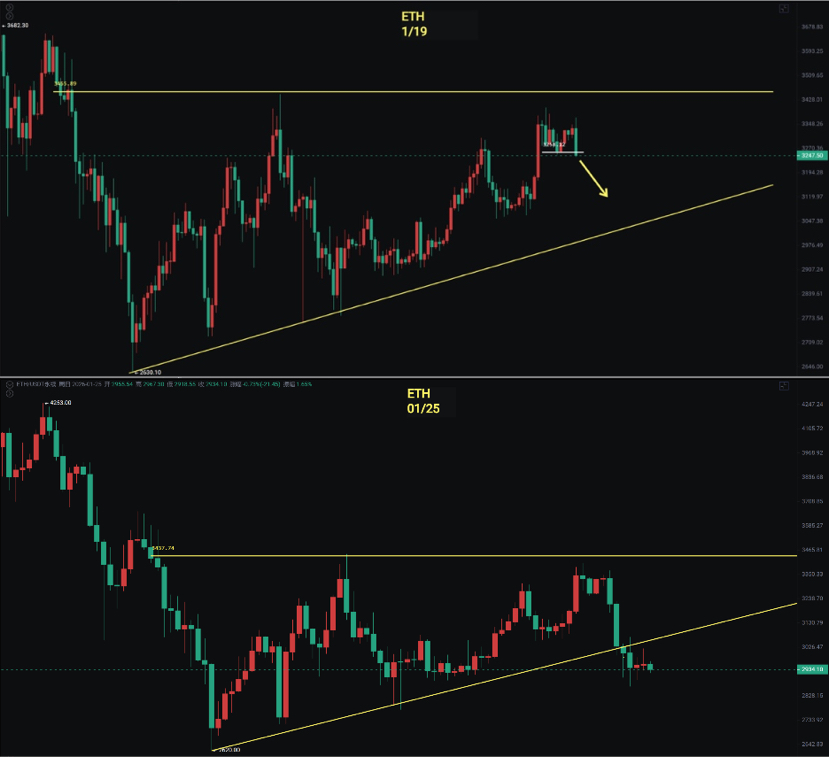
Ethereum
The larger cycle is similar to Bitcoin. The daily line has closed again below 3060, breaking below the lower edge of the ascending triangle and rebounding without recovering. The market remains bearish. However, the gentleman insists on shorting during rebounds and does not recommend chasing short positions.
Support: 2623 to 2775
Resistance: 3060 to 3260