
📰 Daily Market Update:
Over the past two weeks, Ethereum price action has been strongly influenced by what’s happening inside the derivatives market, especially on Binance, the largest crypto exchange by trading volume.
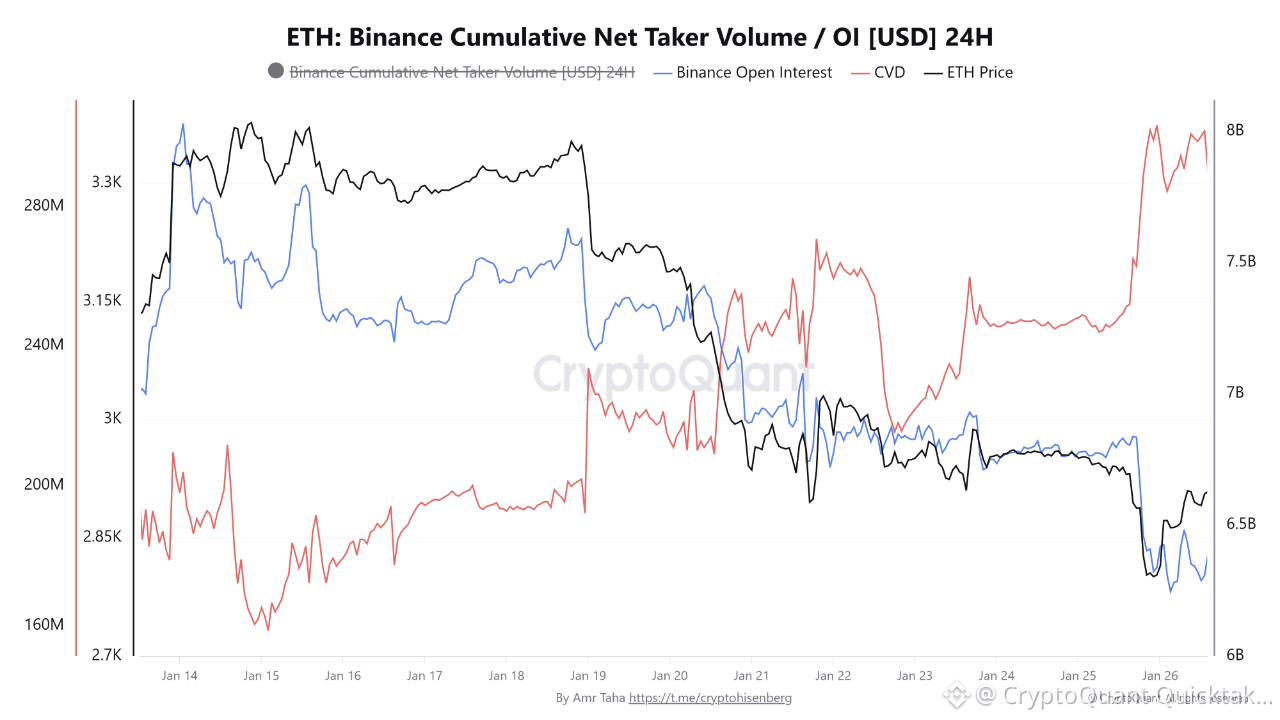
📊 ETH: Binance Cumulative Net Taker Volume / OI [USD] 24H
📉 The first chart clearly shows a sharp decline in Ethereum derivatives Open Interest on Binance.
📉 Open Interest dropped aggressively from around $8 billion to nearly $6.4 billion in less than two weeks, which is a very significant contraction in leverage.
📉 This drop in OI happened at the same time Ethereum price was falling, with ETH currently trading below the $3,000 level.
📈 What is interesting here is that CVD moved higher while Open Interest was declining.
This behavior suggests that the majority of the OI reduction came from short positions being closed.
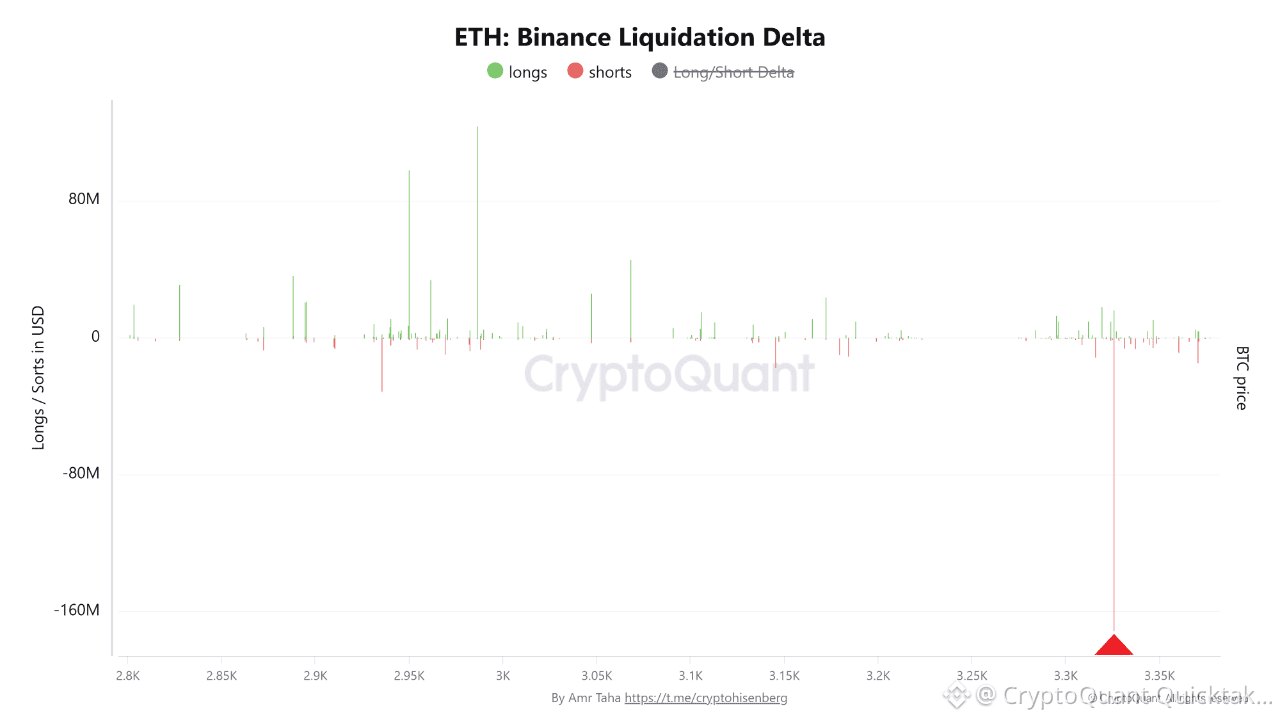
📊 ETH: Binance Liquidation Delta
The liquidation delta chart shows where forced liquidations have taken place at different price levels.
💥 The chart highlights a major short liquidation event above the $3,300 level on Binance.
📉 This event was actually the first warning signal that Ethereum could start a reversal, since once late shorts are wiped out, upside momentum usually weakens.
🗺️ ETH Liquidation Heatmap
The liquidation heatmap shows another important side of the story.
📉 During Ethereum’s decline over the last two weeks, large liquidation clusters of late buyers (longs) were completely destroyed.
As price moved lower, these highly leveraged long positions were forced to close, adding more selling pressure into the move.
🧠 Final Thoughts
Tracking derivatives metrics like OI, CVD, and liquidation maps offers real-time insight into trader behavior, providing a clearer view of the factors driving price action, especially in the short to medium term.
Written by Amr Taha
