
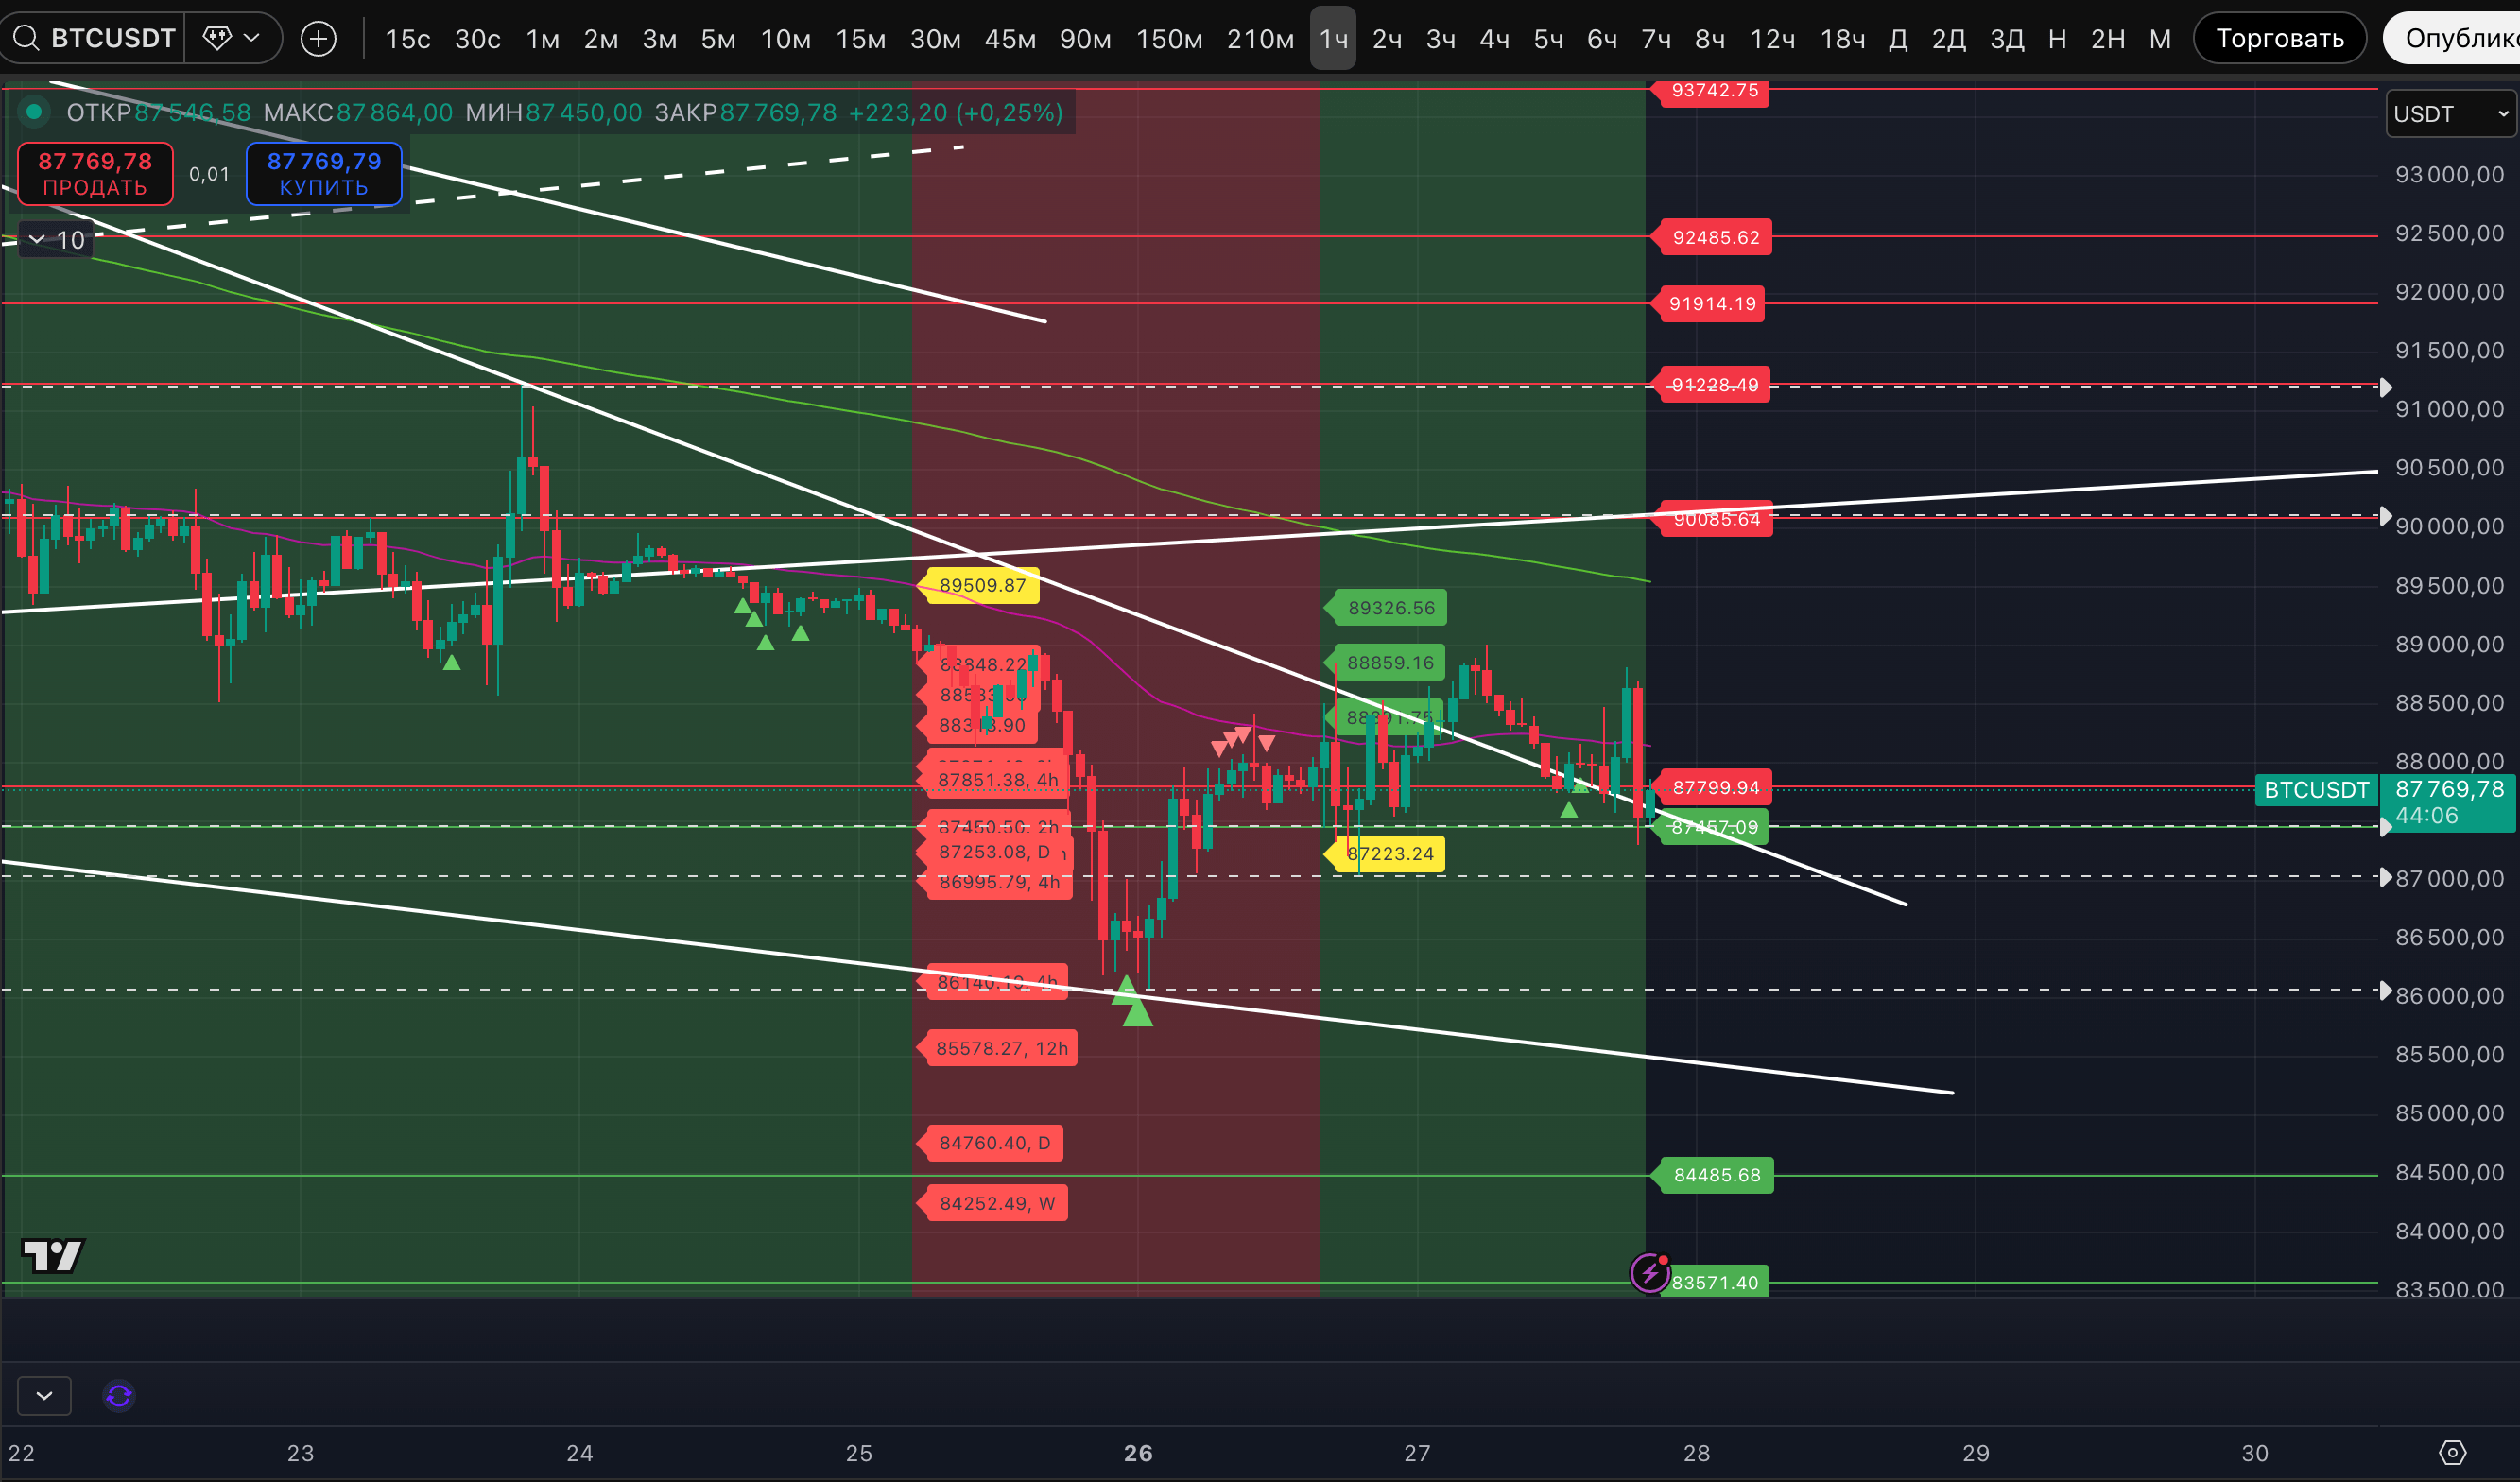
BTC is in no hurry to show the impulse execution of two bullish patterns and is again testing the zone 87,457-87,799$. We remind you of the "Dragon" with targets of 91,225$ and 95,531$ and the "Bullish Wedge" with a target of 95,840$. We wrote about them at night. They have been formed, but have not yet even executed the nearest target.
In recent days, we have repeatedly stated that 87,457-87,799$ is an important support level, under which the range of impulse movements is 84,485-87,799$. Last time, the breakout at 87,799$ cost liquidations for 200,000 traders and a price drop to 86,074$. Most of this journey was covered by a single hourly candle. After that, a strong signal of potential lows on the hourly timeframe started a rebound, which led to the formation of bullish patterns and the start of their execution.
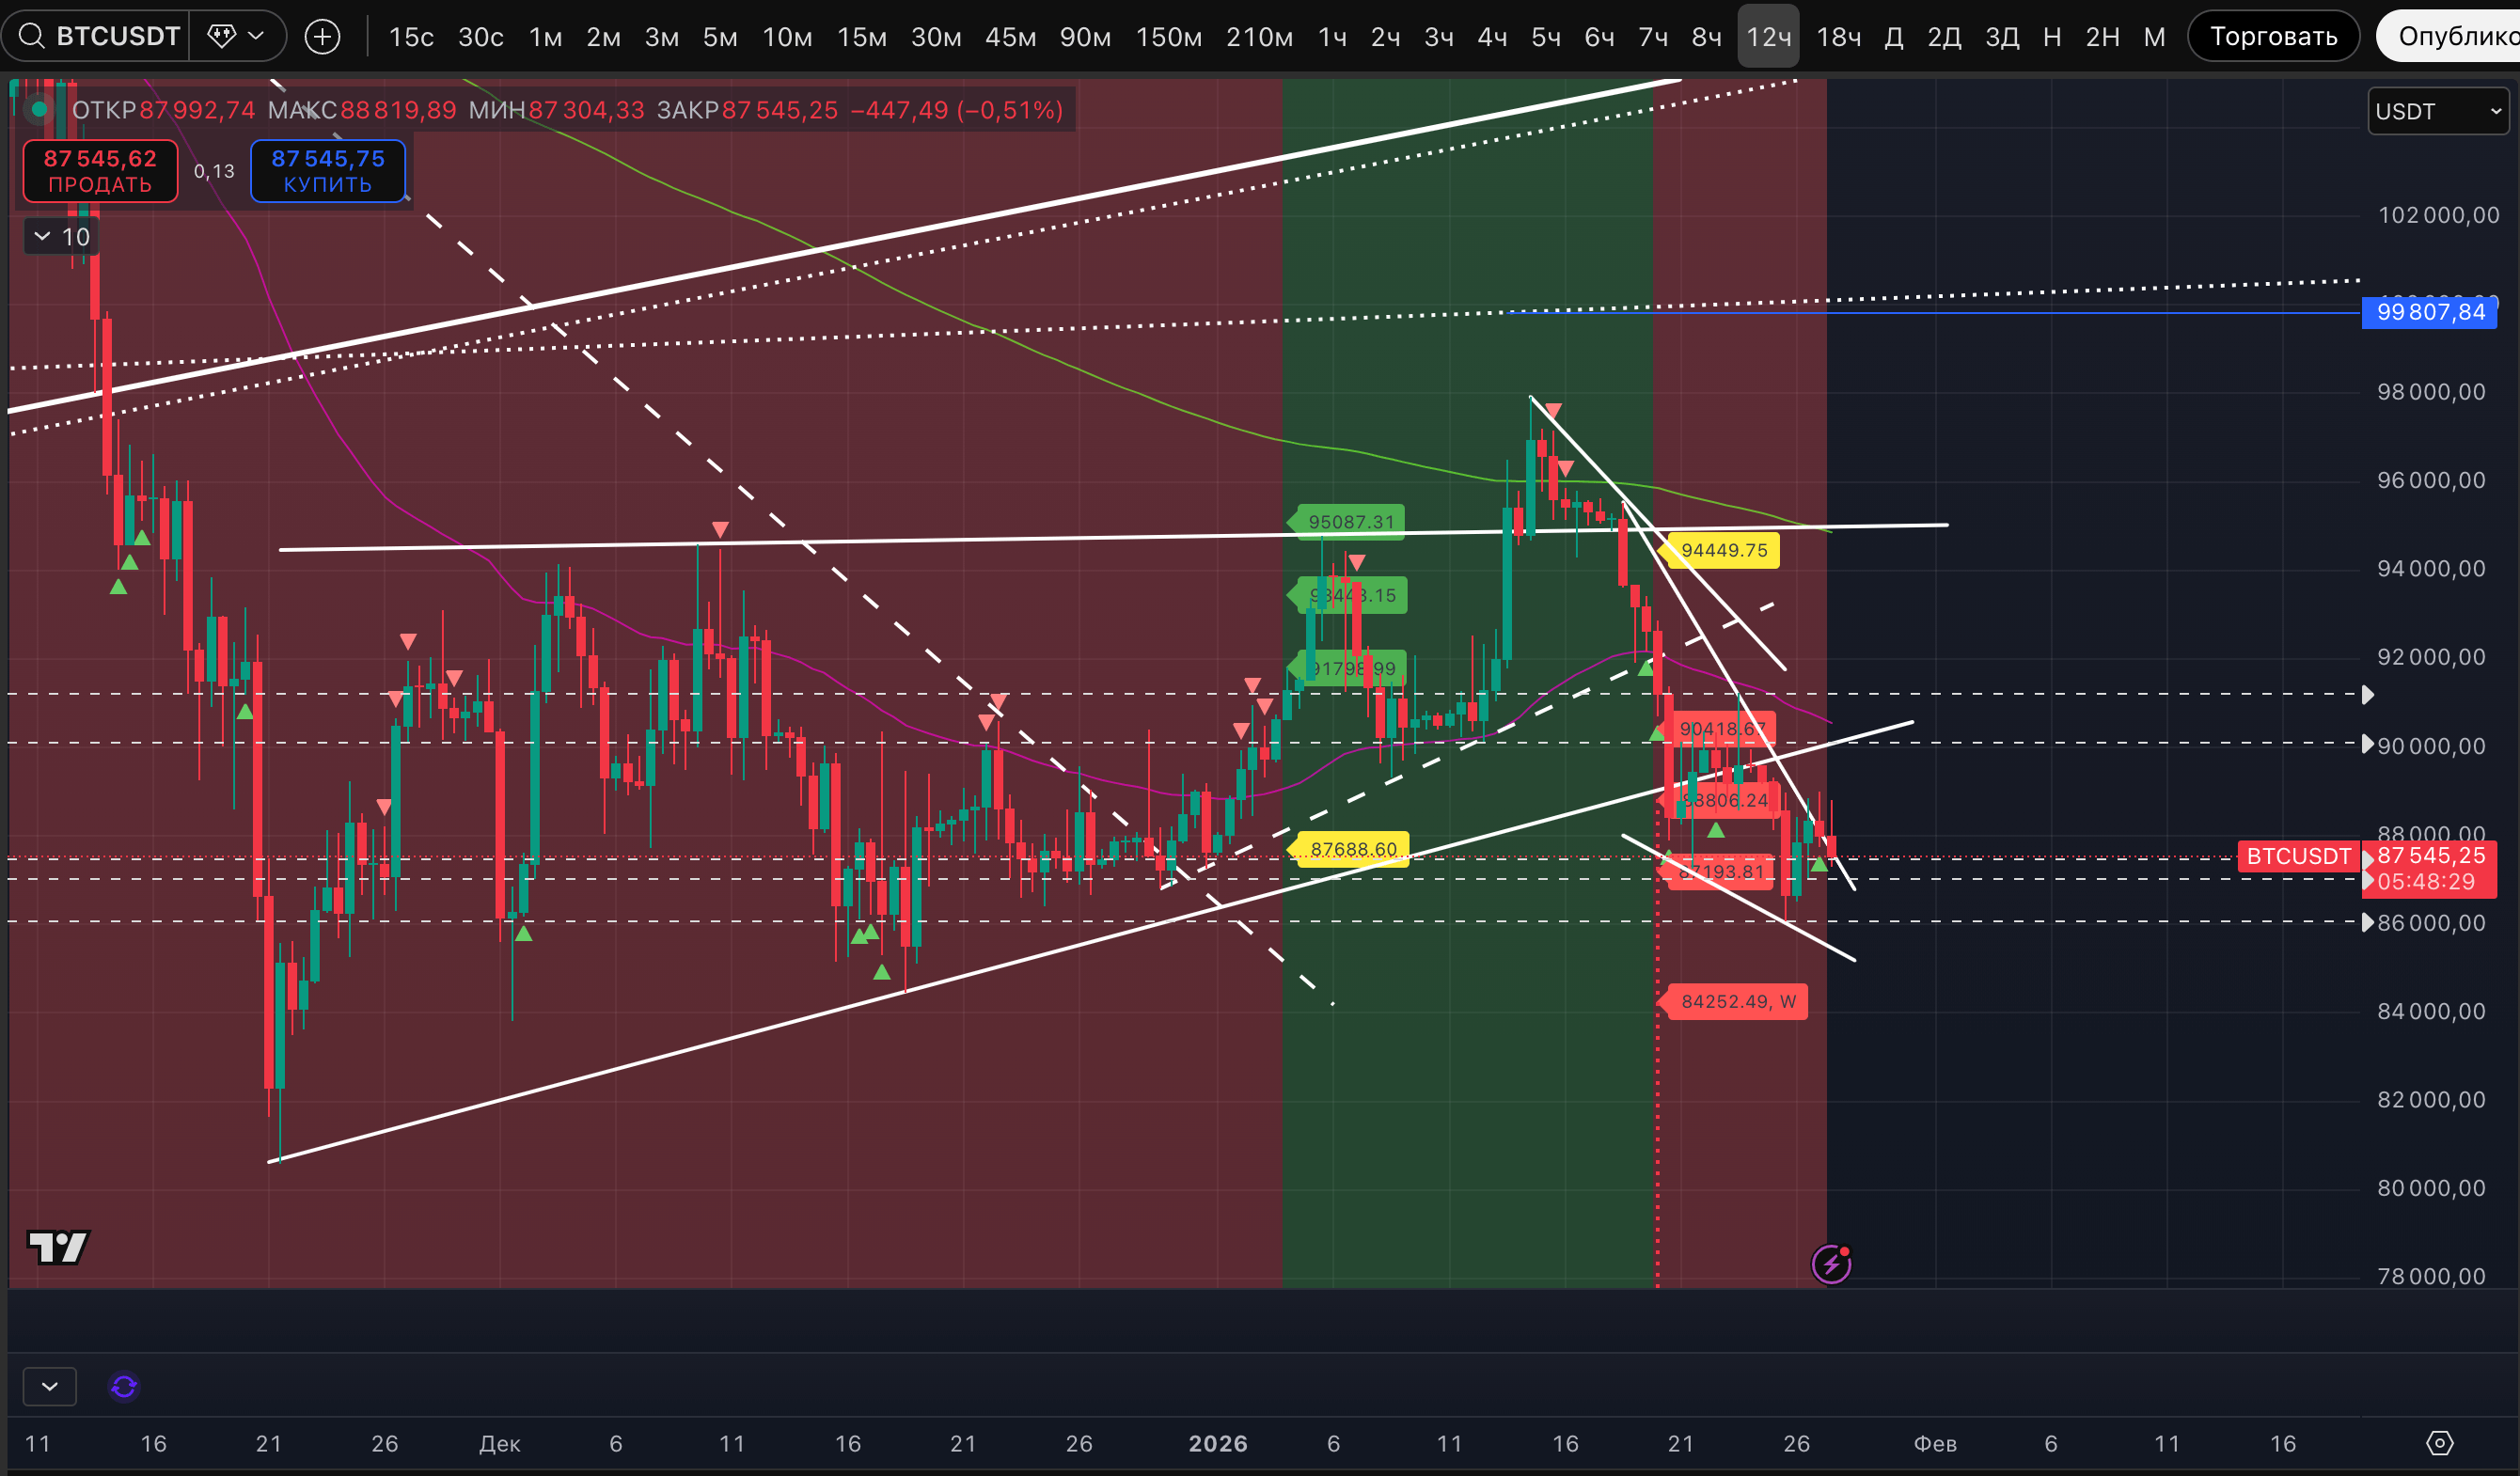
But for now, the price is behaving unusually in the context of the "Dragon" pattern during the breakout of the "spine line" and this is a risk. The necessary impulse at least to the first target of $91,225 is not visible.
On the side of the probability of continued growth - the fact that the last 12-hour candle closed with a potential low mark.
But the marks for growth are not enough - a change in stable trends is needed. And here the situation is still weak. Since the release of today's night review, there has only been one positive trend on the #BTC chart - the price has transitioned into a stable uptrend on the 1.5-hour timeframe, with basic targets of $89,032, $89,637, $90,243. And the potential breakdown level of $87,518, which we are currently testing, having not yet reached any of the targets.
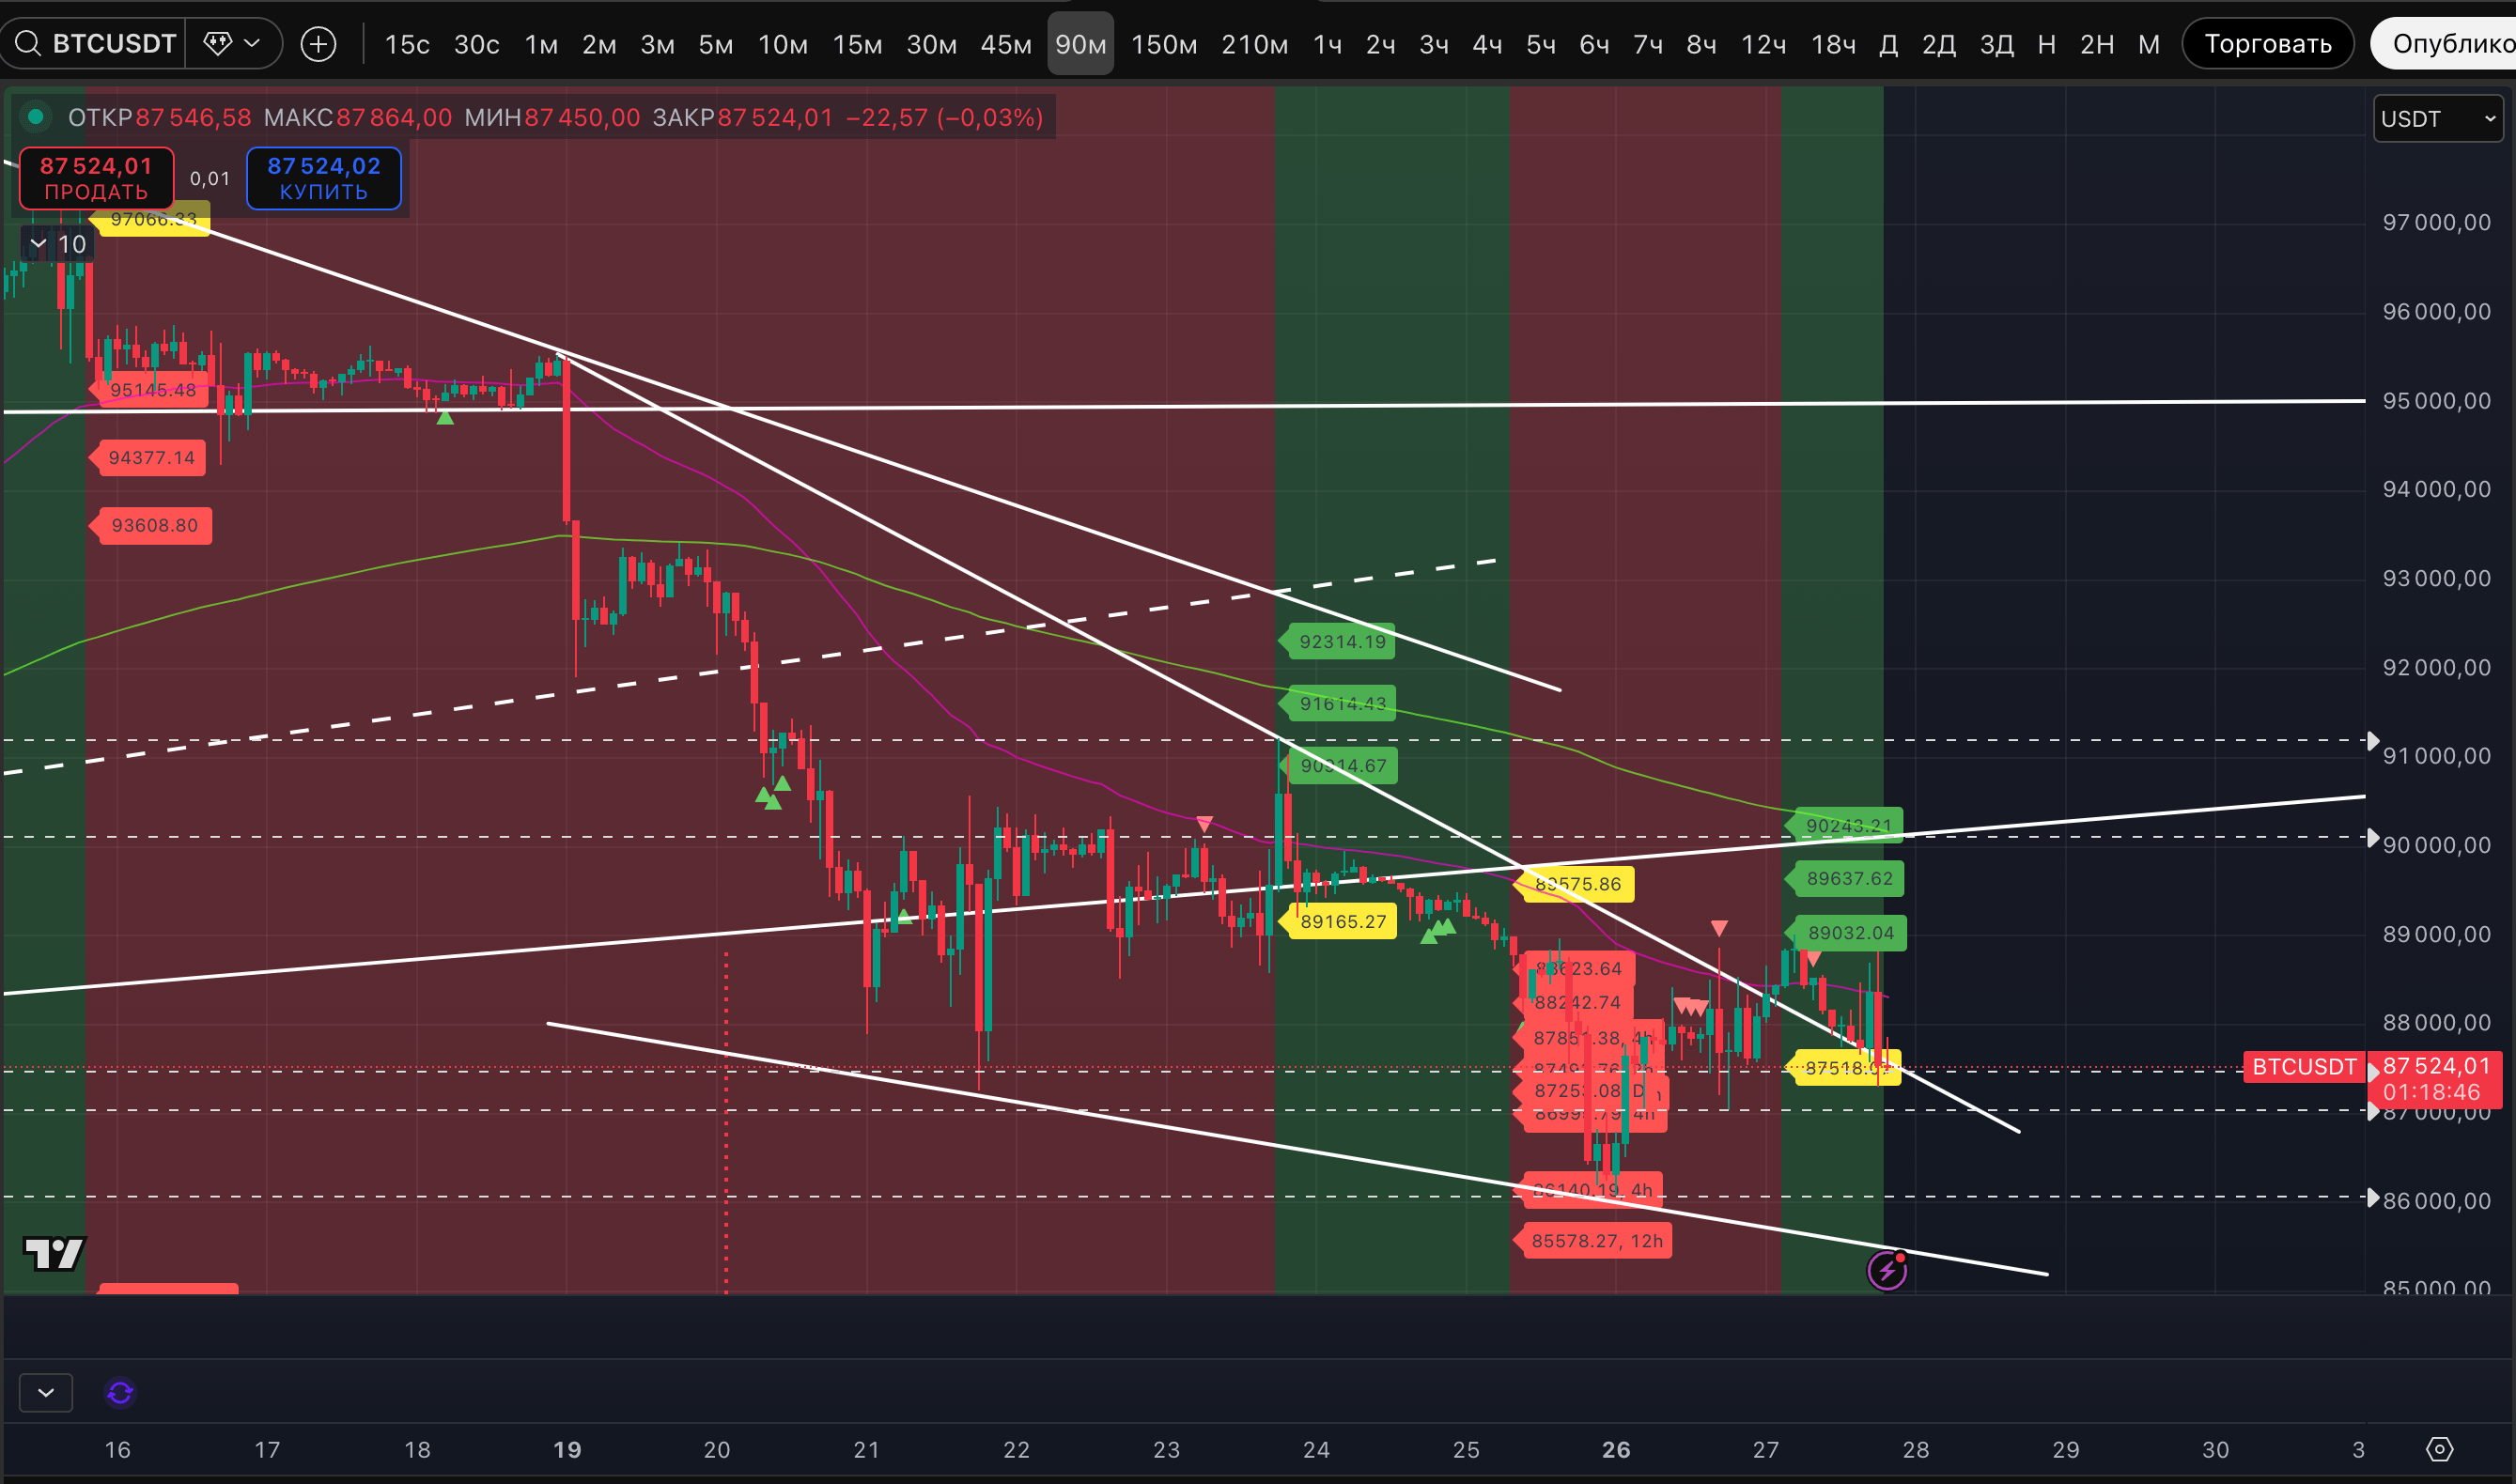
In the last hour, the price showed an impulsive drop and this is a "slap" for those who believed that yesterday's loss of gold and silver capitalization by $1.8 trillion was intended for the cryptocurrency market. #BTC is showing weakness again and if it shows a return below the trend line since January 18 and a return to a downtrend on the hourly timeframe - this will most likely open the way to test the next support according to our P73 Key Horizontal Levels indicator (formerly P73 Smart Liquidity Zones) - the previously mentioned level of $84,485.
The situation is hanging. The current strength of buyers is clearly insufficient for the continuation of growth. Until we see stable uptrends on the 2- and 3-hour timeframes, it's hard to talk about their strength.