Looking at the 4 hour chart of BNB on Binance, it’s clear the price lost strength after trying to push above the 900 level. Around 909, sellers stepped in strongly and since then the market has been moving lower step by step.
After that rejection, BNB dropped fast and broke below the short term averages. You can see how price didn’t stay above those levels for long. Once buyers failed to defend the area around the mid 860s, selling pressure increased and pushed BNB down close to 830.
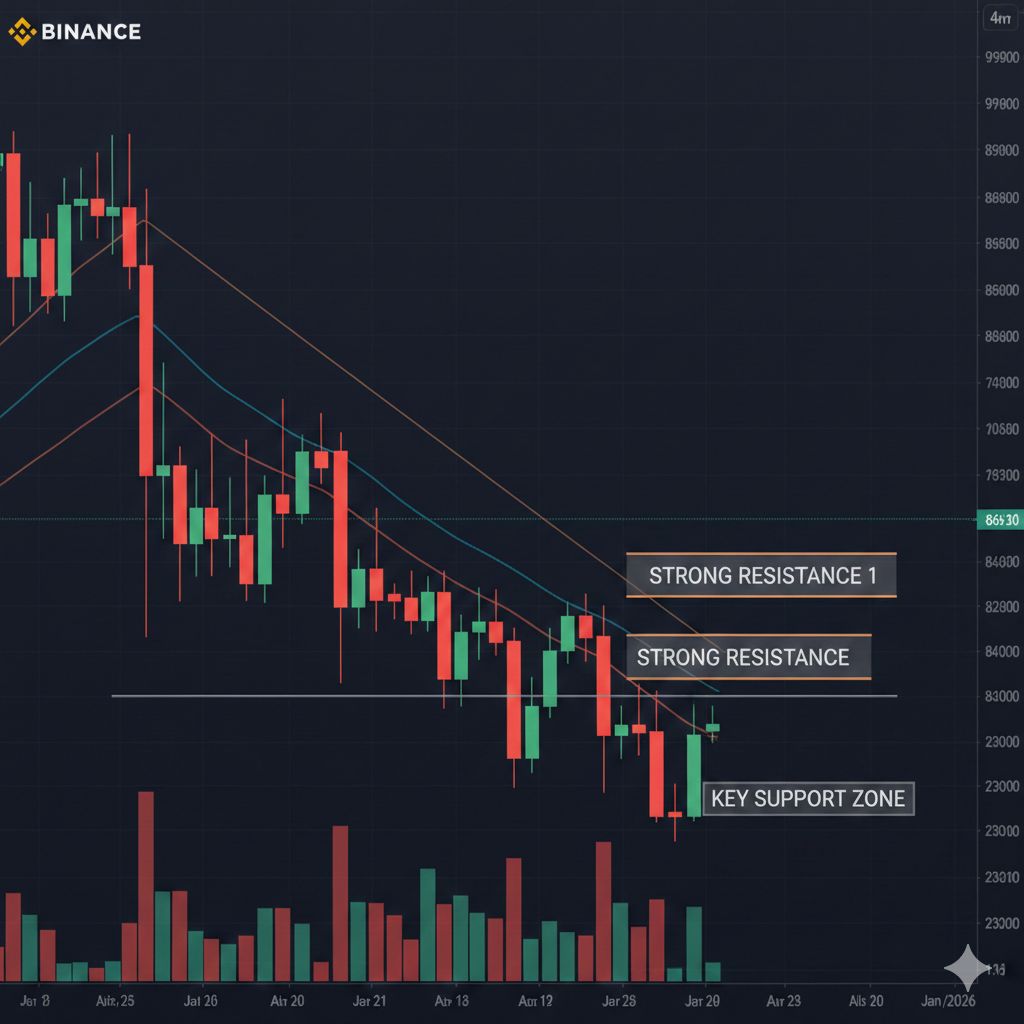
There was a small bounce from around 831, which shows some buyers are still watching that zone. But the bounce was weak. Volume didn’t really support it, and price couldn’t move back above important levels. Instead, it rolled over again and came back near 838.
This usually means sellers are still in control for now.
Another thing that stands out is how heavy the selling candles were during the drop from 900. That wasn’t just slow drifting down. It was real pressure. On the way up earlier, candles were smaller and smoother. On the way down, moves were faster and stronger. That often shows a shift in momentum.
Right now, the area between 830 and 835 looks like an important support. If BNB can stay above it and start forming higher lows, we might see a recovery attempt. But if that zone breaks, price could easily test lower levels around the low 820s or even near 800.
On the upside, any bounce will first struggle near 860. That level already acted as support before and now it’s resistance. Above that, the 880 to 890 area is even stronger because multiple averages are sitting there.
Short term, the market still feels heavy.
But long term, BNB is not a weak coin. It’s backed by Binance and has real usage across trading fees, staking, and the whole BNB Chain ecosystem. Many times in the past, sharp drops like this ended up being just pullbacks before stabilization or recovery.
For now though, patience is important.
If buyers can defend current support and volume starts increasing, we could see a bounce. If not, more downside pressure may come before things settle.
Overall, the 4 hour chart shows BNB in a correction after failing to break higher. Sellers have control in the short term, while support around 830 is the key level to watch next.
$BNB #BNB_Market_Update @BNB Chain