
STH-RP (STH Realized Price) calculates the price at which the last on-chain movement of addresses holding coins for less than 155 days occurred. In plain terms: where is the 'average cost' for those who bought BTC in the past 155 days — it represents the overall cost center for short-term holders.
Many friends equate it to SMA120 in candlestick technical theory, but they are fundamentally different. STH-RP is the 'human' cost, while SMA120 is the average of 'prices'; one reflects behavioral structure, and the other is mathematical smoothing.
SMA120 changes almost in tandem with price fluctuations, while STH-RP depends on the positions of the holding group during the last and current turnover. Theoretically, if high-priced chips remain still during a BTC drop, then STH-RP will not decrease with the price; conversely, the same applies.
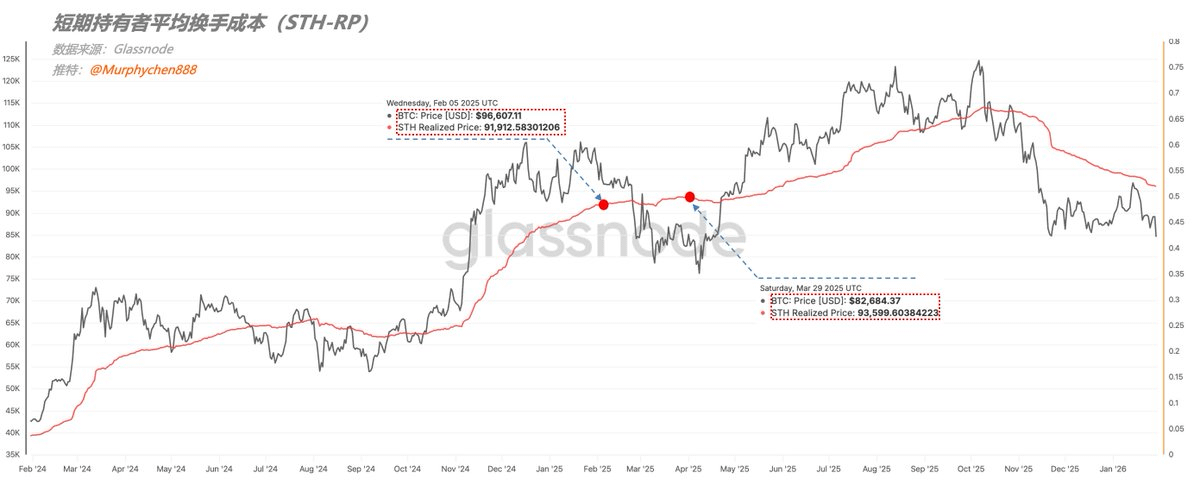
In many instances, we find a directional relationship between STH-RP and BTC prices, where the price decreases while STH actually rises. For instance, in Figure 1, on February 5, 2025, BTC was $96,000, STH-RP was $91,912; by March 9, BTC fell to $82,000, but STH-RP rose to $93,599.
This indicates that when BTC is falling, the chips that are changing hands are mostly low-position to low-position (short-term trading), and very few are high-position to low-position (cutting losses), with some being low-position to high-position (taking profits), thus STH-RP actually increased.
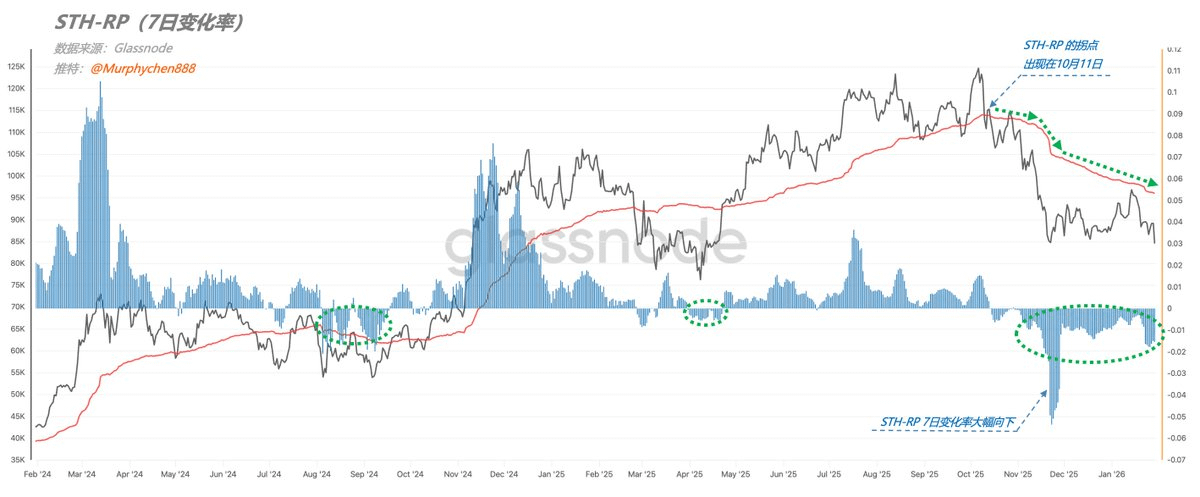
This wave of adjustment currently appears to be fundamentally different from that in March 2025: when prices are falling, STH-RP simultaneously drops rapidly; if the slope of the curve is not yet obvious enough, we can add an algorithm - calculate the '7-day change rate'; from the amplitude of the waveform fluctuations (comparing August 2024 and March 2025), it is not difficult to see how severe the 'degree of decline' is.
This indicates that during this period, there has been a large amount of 'high-position to low-position' activity, and the market is indeed panicking; only when confidence collapses will such irrational behavior of cost-ignoring and rapid exit occur. However, the turning point from a sustained rise to a sustained decline in STH-RP occurred on October 11, 2025.
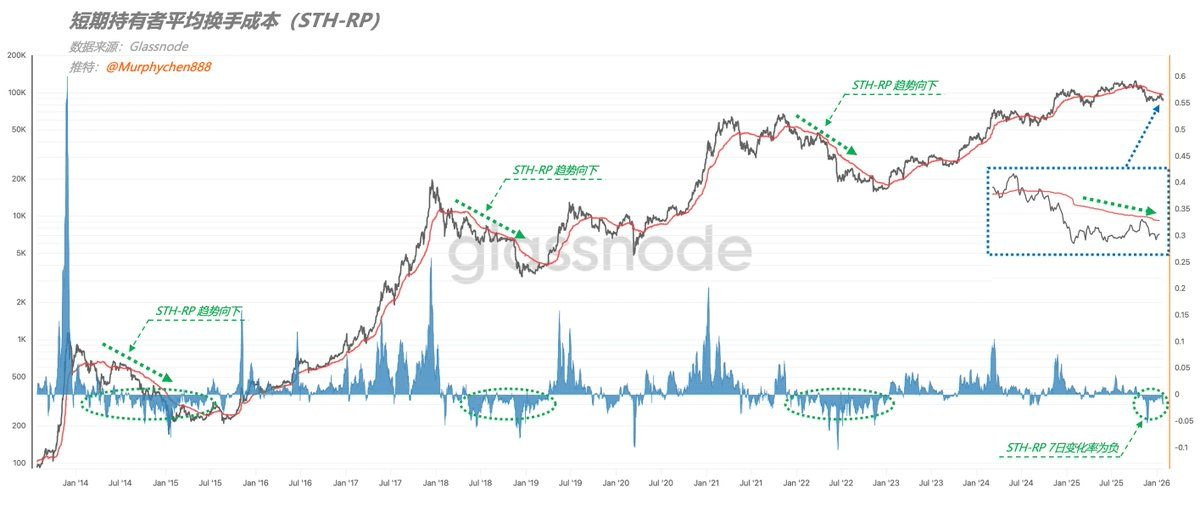
So, if we take another look at this full cycle chart of BTC's STH-RP, we can understand the several positions where I drew the green dashed lines, which correspond exactly to the periods when each round of cycles transitioned from bull to bear. Although the historical context has its differences, STH-RP has consistently shown a rapid downward trend, with the 7-day change rate significantly and continuously turning negative.
Note! This does not mean that the occurrence of this phenomenon will definitely lead to a deep bear mode, but rather that every time we enter a bear market (which could also be a phase bear market), it is caused by a fundamental change in 'investor sentiment'. In other words: macro changes expectations, expectations influence sentiment, sentiment drives behavior, behavior determines supply and demand, and supply and demand reflect prices.
In essence, our study of on-chain data is about analyzing investor behavior, inferring market sentiment from behavior, and corroborating current behavior with macro events to verify whether it is reasonable. If it is, then the sentiment is genuinely objective, and ultimately it will reflect in the price.
(Sometimes, if we analyze incorrectly, it indicates a problem with the interpretation of data; or a special event has altered expectations; the former requires reflection and summarization, while the latter requires timely adjustment. It's okay to be wrong and face criticism, what matters is not to become complacent and rigidly cling to past assumptions, ultimately misjudging oneself.)
