
#XRP #XRPUSDT #Altcoins
This is definitely a scary situation, the XRPUSDT chart is now mixed.
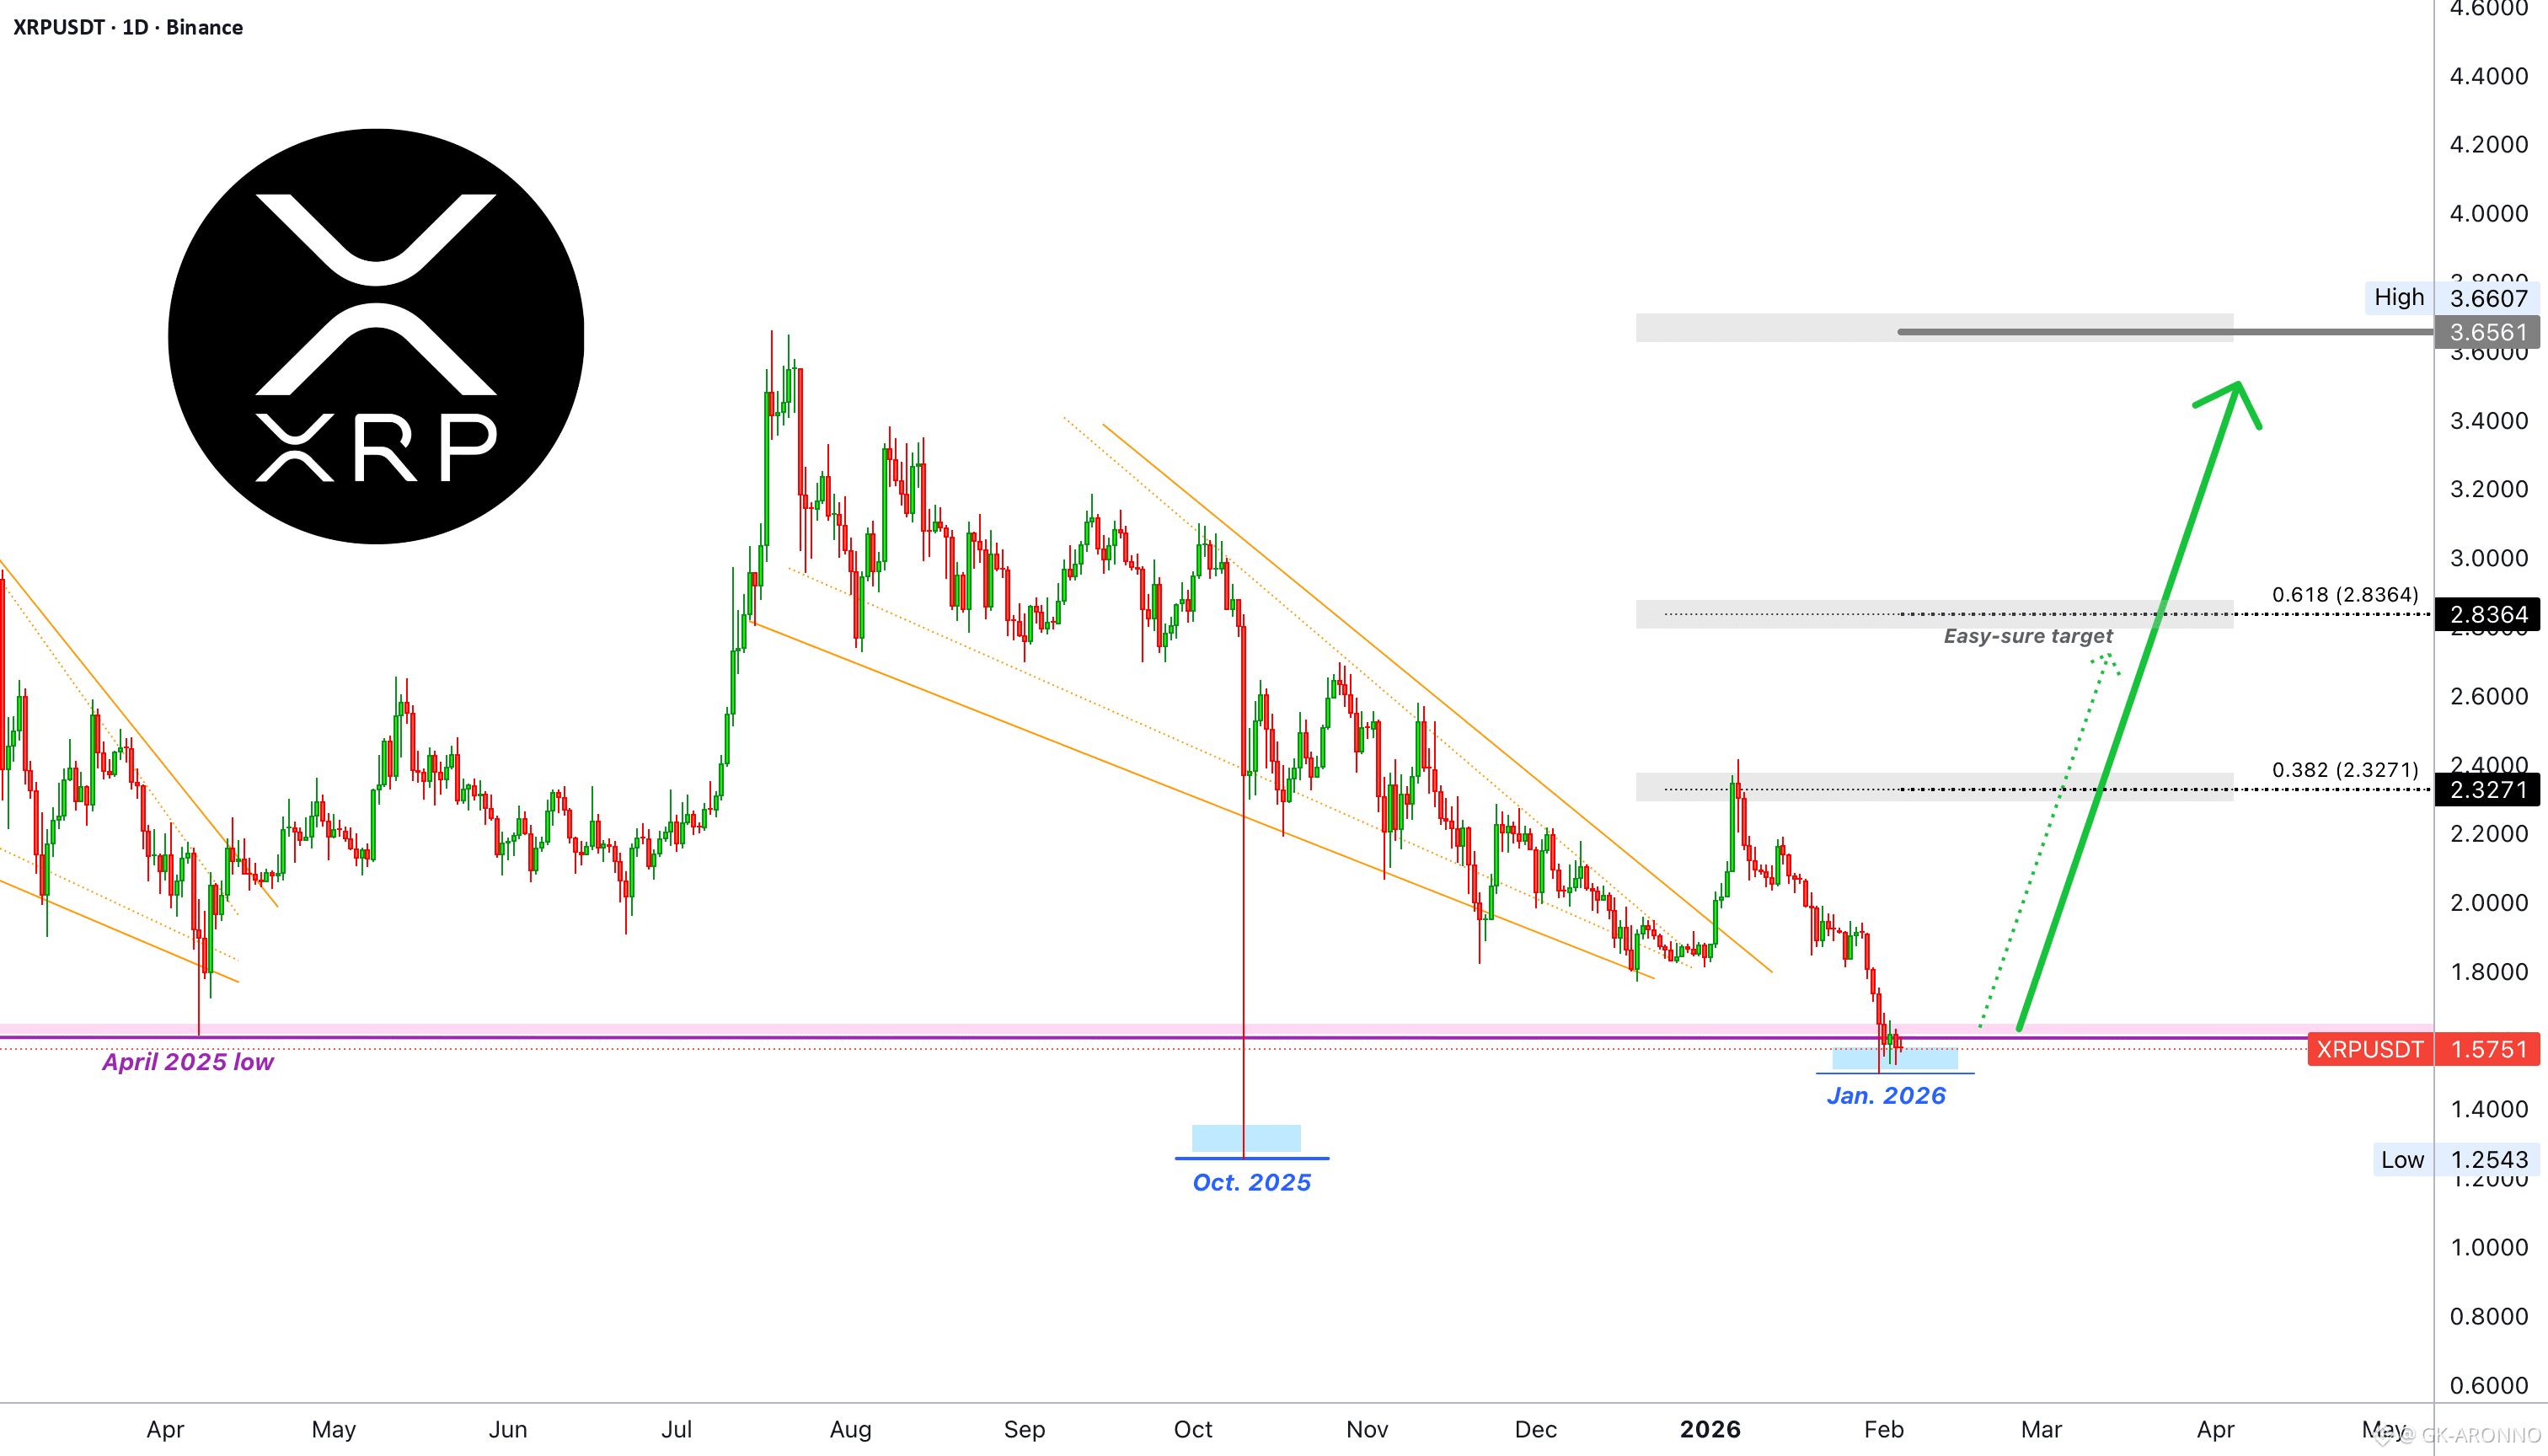
The main level we looked at, and what defines for us at this point in time bullish potential, is the April 2025 low—the purple line on the chart. The action is now happening below this level which can be considered bearish. The action is also a higher low compared to October which is bullish. What to expect?
The down-move that started 6-January can be considered a continuation of the drop that started 18-July 2025. It can also be considered a stop-loss hunt event. If the latter is the case, this would favor the bulls. Why a stop-loss hunt event?
If you notice the size of the main wave, the falling wedge pattern, the second move is much smaller. So this isn't the same type of dynamics. The second move is not a full blown bearish impulse or correction but rather a minor retrace.
The lower low recently compared to last year, mid-December, means the bulls weren't strong enough at resistance. The $2.33 price level shown on the chart.
Since the market clearly showed a lack of break through on this zone, then the bears entered. The bulls were rejected right away at resistance while the bears remain below support. This is again mixed.
The size of the move, the mid-term higher low and some other market conditions support a bullish bias but not necessarily right away.
Here is the conclusion: XRP can move up as the next major move but it still needs more consolidation. It can happen that we get one more shakeout, one more flush and then up. It can happen that the action moves back above support.
If we get a bearish resumption, the next low should come up fast and close to the last low. A reversal can take several days to appear but no more than 2 weeks.
It seems a decision will be reached in a matter of days. Overall, we are expecting a new bullish phase, but this does not mean that there can't be one more flash crash, another drop before the reversal.
Thank you for reading.
Namaste.
✅ Trade here on $XRP
