
First of all allow me to wish everyone Merry Christmas with Tradingshot's best wishes to everyone for great health and prosperity!
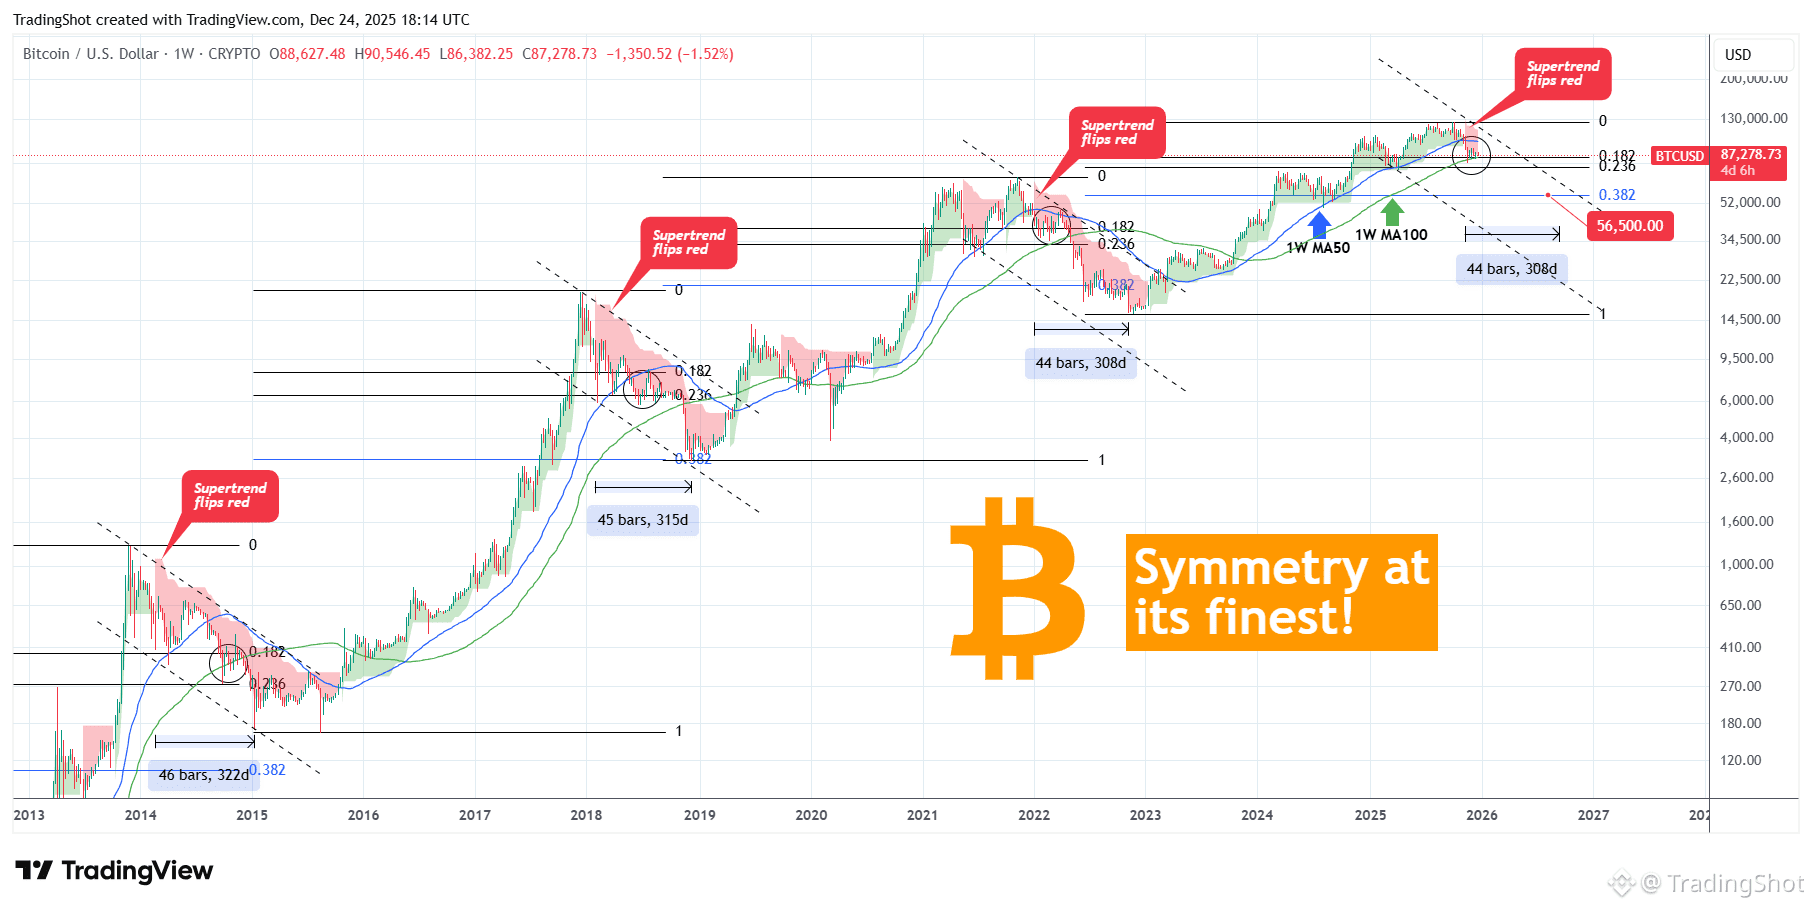
Now as far as Bitcoin (BTCUSD) is concerned, this chart on the 1W time-frame displays once more its symmetry among Cycles at its very best.
They key component here is the Supertrend. Every time this indicator turned red (bearish) as it has done now since November 10, BTC has already started its Bear Cycle. The amazing symmetry here is found in the past 5 weeks when the price has been ranging within the 1W MA50 (blue trend-line) and the 1W MA100 (green trend-line).
As you can see the moment it broke below the 1W MA100, it also breached the 0.182 Fibonacci retracement level and entered the 0.182 - 0.236 Fib Zone. This has happened every single time with remarkable precision since the 2014 Bear Cycle. The last two Cycles bottomed on the 0.382 Fib at least.
So what does that mean for us now/ today? Well first of all, the current Bear Cycle is likely to reach $56500 (0.382 Fib) at least. Secondly, every Bear Cycle bottomed around 44 - 46 weeks after the Supertrend turned red. This gives us a fair time horizon for the potential bottom around September 14 2026.
Please LIKE 👍, FOLLOW ✅, SHARE 🙌 and COMMENT ✍ if you enjoy this idea!
