By 2040, the price of 1 Bitcoin = 290 million yuan: you will never spend even 1 Bitcoin in your lifetime.
I wanted to write about this topic back in October last year, when Bitcoin was still below 70,000 USD. I didn't expect that after my delays, Bitcoin has already surpassed 120,000 USD. Let's use 55,000 USD (400,000 yuan) as a benchmark price for 2024.
OK, why do I say that you might never spend even 1 Bitcoin in your lifetime? We still take past data to discuss this, conducting an interesting 'hypothetical experiment.' Not as investment advice, just for fun.
In 2017, after careful consideration, you decided to use 10,000 yuan to buy one Bitcoin as a "store of value." You also set a time limit of five years, during which you would not hold it. After purchasing it, you deposited it into your personal Bitcoin wallet, kept the private key safe, and never cared about the price fluctuations of Bitcoin again.
Starting in January 2022, five years later, I will sell only 3,000 yuan worth of Bitcoin each month to cover my daily expenses, ideally on the 1st of each month. I don't know why, but maybe I just happen to have the Bitcoin price on the 1st of each month.
Therefore, please refer to the table:
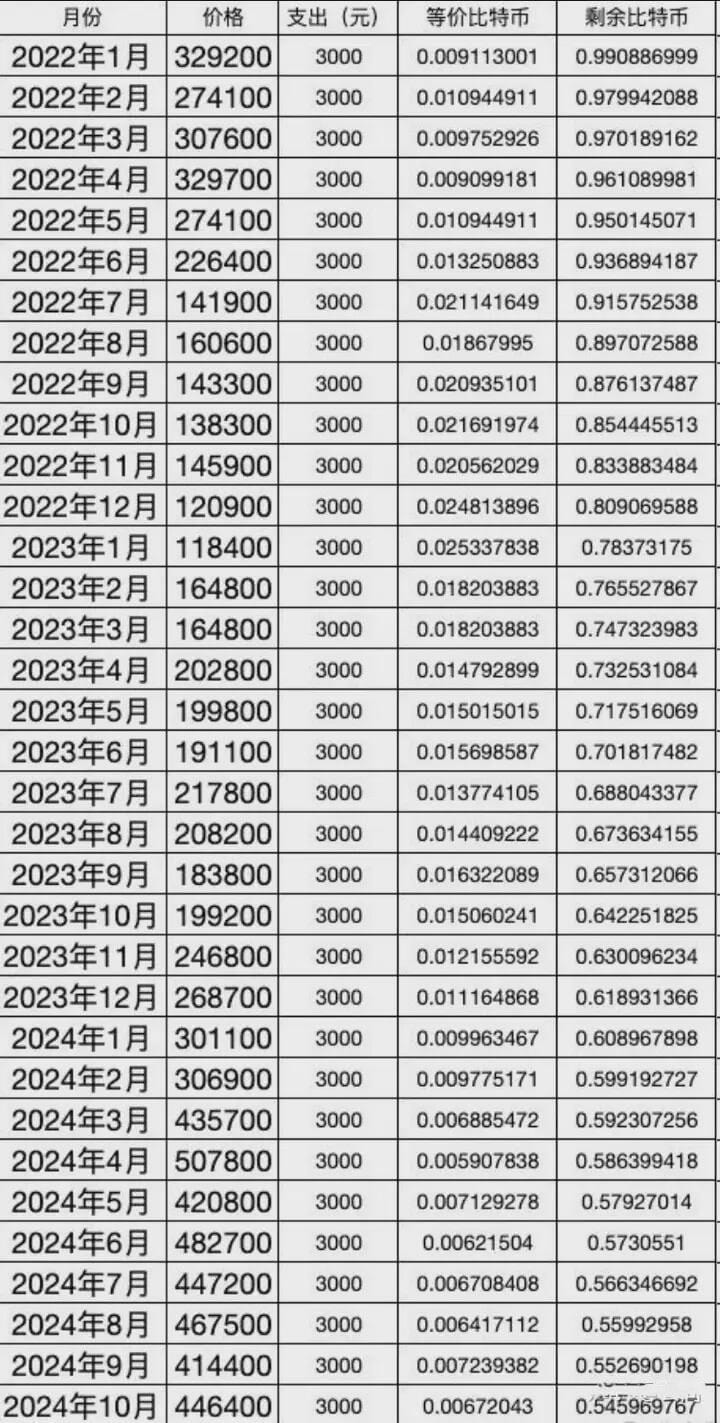
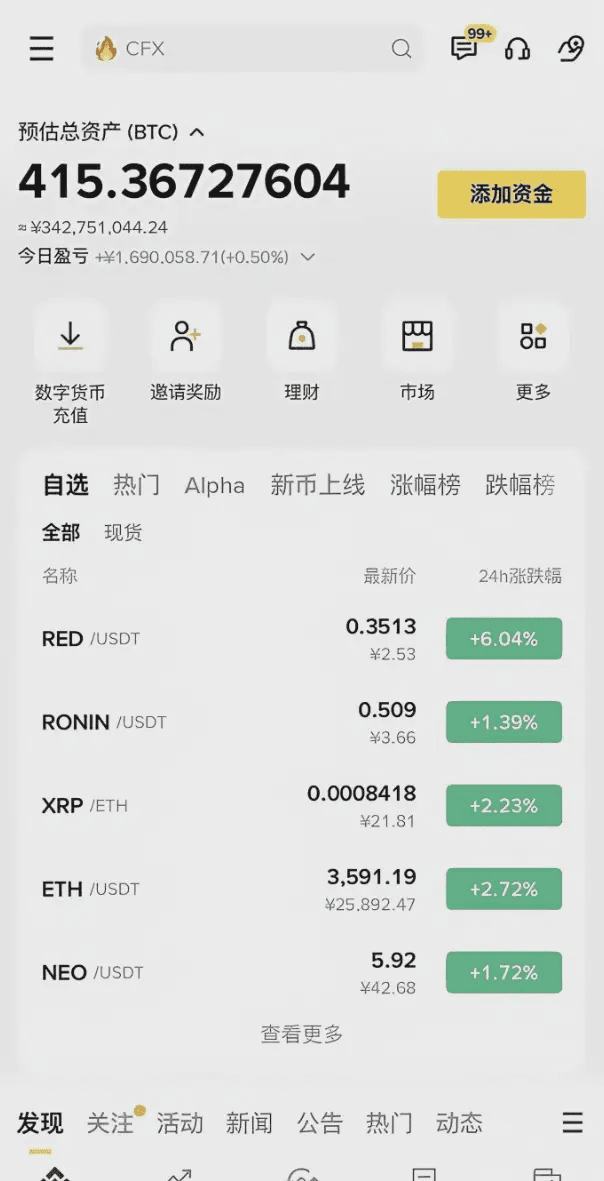
From January 2022 to November 2024, a period of 3 years, you have used a total of 0.46 bitcoins, exchanged them for 105,000 yuan in cash, and have 0.54 bitcoins remaining, currently worth 340,000 yuan.
Further statistics are compiled here to facilitate subsequent "experiments".
In 2022, you used a total of 0.191 Bitcoins; in 2023, you used a total of 0.165 Bitcoins; and in 2024, you used a total of 0.079 Bitcoins. Although the price of Bitcoin did fluctuate significantly, you noticed that the amount of Bitcoin you needed to use each year and each month was gradually decreasing.
In 2022, the average price of Bitcoin was 216,000 yuan; in 2023, the average price of Bitcoin was 197,000 yuan; and in 2024, Bitcoin is tentatively estimated at 400,000 yuan (the actual price is currently 600,000 yuan). To make the data as accurate and reliable as possible, we have to include previous Bitcoin data as well.
In 2019, the average price of Bitcoin was 50,000 yuan; in 2020, the average price of Bitcoin was 75,000 yuan; and in 2021, the average price of Bitcoin was 300,000 yuan.
So from 2019 to 2024, in five years, Bitcoin rose from 50,000 yuan to 400,000 yuan (this is a conservative estimate, it should be 600,000+ yuan), with an average annual growth rate of about 51%. Let's continue our "experiment" based on this data.
In 2024, assuming a price of 400,000 and an average annual growth rate of 51%, and with very stable prices and restrained spending, by 2040, 1 Bitcoin will be worth 290 million yuan. Ultimately, you'll have spent most of your life on just 0.64 Bitcoins.
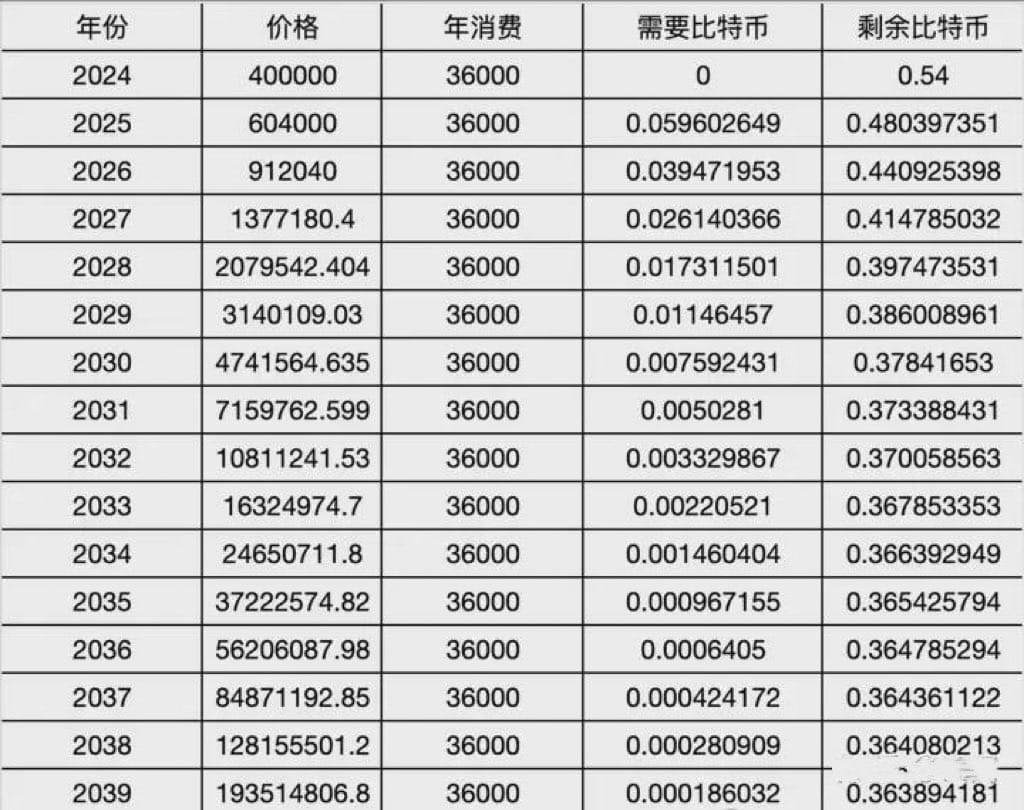
The remaining 0.36 bitcoins seemed to be under a spell; no matter how you tried to spend them, you couldn't, so you had no choice but to continue living an ordinary, simple life.
Those who hold the cryptocurrency are either excited or anxious. Excited holders likely hold more than 0.6 units, while anxious holders may only hold between 0.001 and 0.1 units. Ultimately, it's best to remain calm. As the saying goes: If I gain it, I'm fortunate; if I lose it, it's fate.
As for those who are about to call for my execution, there's no need for that. This is an experiment, purely an academic discussion, and we'll have to wait and see what the final result is.
This is what is called:
The cryptocurrency market is a tangled mess, with wildly fluctuating prices attracting countless investors.
Idle gossip is like a dream, and absurd tales are like fleeting blossoms.
Laughing and chatting, ignoring worldly affairs, enjoying a cup of tea in carefree ease.
It is a pleasure to gather here with you all; I am grateful for this time together.
I was born in 1989 and work full-time trading cryptocurrencies. My assets are in the tens of millions. I withdraw 100,000 yuan from the crypto market every month, and it doesn't affect me at all. I live a leisurely and free life, without any deceit or backstabbing. I live the life I want.
Every morning, I go for a run first, then come back and make myself breakfast. After eating, around 9:00 AM, I turn on my computer and review yesterday's trades. Because trading volume in the crypto market is very low in the morning, I'm usually quite busy in the evening. I take a short break in the morning, then review the trades and summarize the transaction records into my trading system. Reviewing trades is really important!
Around 4 or 5 pm, I usually go for a run in the park or woods, then go home. Sometimes I cook dinner myself, sometimes I order takeout. By the time I finish, it's around 7 or 8 pm, which is usually when the US stock market is about to open, and the crypto market starts to go crazy! Just seize a few opportunities, and you can earn your daily goal!
When trading is slow or the market is in a downtrend, and there are few opportunities to trade, I participate in trading community events or have meals with friends. This kind of communication and socializing is an important way for me to balance work and life, and it also helps me expand my network and learn more about industry trends.
Then, I started analyzing various data and charts, studying market trends and price movements. This was crucial for making the right trading decisions. Sometimes, I would meticulously examine various clues like a detective, looking for potential trading opportunities. In short, it was a very free and easy process.
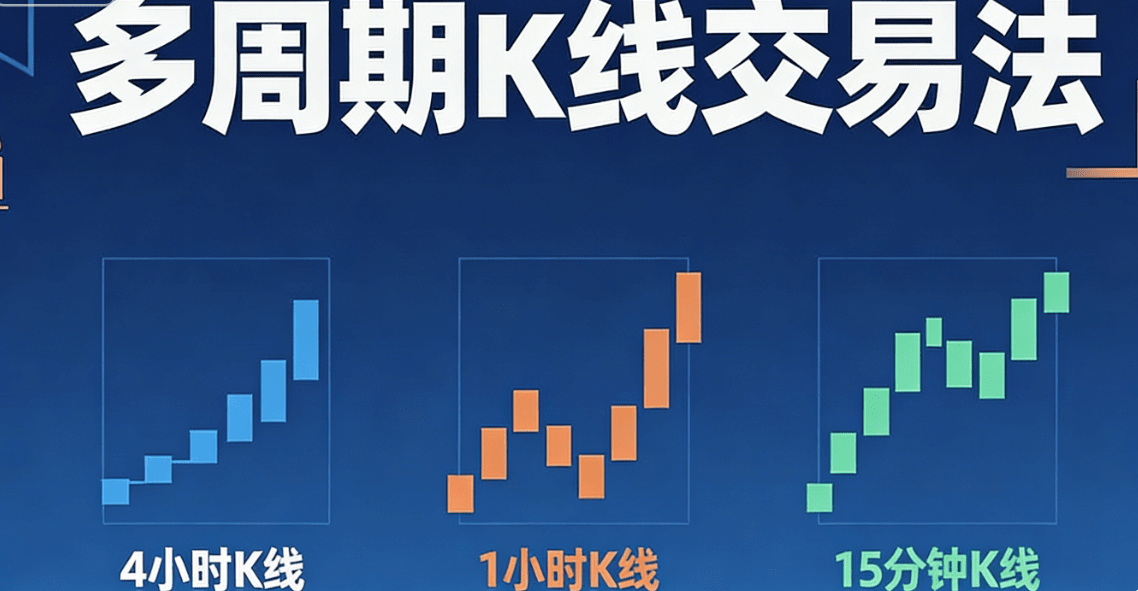
Today I'm sharing with you my multi-period candlestick trading method that I've used for 9 years. It's a simple three-step process to help you determine the direction, entry and exit points, and timing (I suggest liking and saving this so you don't lose it next time).
Three steps to help you get some direction, entry points, and timing.
When I first entered the cryptocurrency world, I used to stare intently at 1-minute candlestick charts, my heart pounding with each move. As a result, I either bought too early or sold too late, repeatedly getting "taught a lesson" by the market. It wasn't until a tech expert enlightened me that I finally realized: the problem was focusing on only one timeframe!
1. 4-hour candlestick chart: Determine direction and observe the overall trend.
This cycle is sufficient to filter out short-term noise, making the trend clear at a glance:
- Uptrend: Higher highs and higher lows simultaneously → Buy on dips
- Downtrend: Highs and lows are decreasing simultaneously → Sell on rebounds
- Sideways movement: Prices fluctuate within a range, making it easy to make drastic moves in either direction. Frequent trading is not recommended.
Remember: Trading with the trend increases your chances of winning; trading against the trend will only lead to losses.
II. 1-hour candlestick chart: Divide the range and find key levels.
Once the major trend is determined, use the 1-hour chart to identify support/resistance levels:
- Positions near trend lines, moving averages, or previous lows may present good entry opportunities.
When the price approaches previous highs, key resistance levels, or forms a topping pattern, consider taking profits or reducing your position.
III. 15-minute candlestick chart: Make moves and seize opportunities
This cycle only focuses on finding entry points, not on trends:
- Wait for key price levels to show short-term reversal signals (such as engulfing patterns, bullish divergence, or golden crosses) before making a move.
A breakout accompanied by increased trading volume is more reliable; otherwise, it's easy to encounter false signals.
Multi-cycle coordination steps:
1. Determine the direction: Use the 4-hour chart to determine whether to go long or short.
2. Identify areas: Use the 1-hour chart to circle the support or resistance zones.
3. Precise Entry: Use 15-minute charts and other "final" entry signals.
Here are a few key reminders:
If multiple timeframes show conflicting directions, it's better to remain on the sidelines and observe than to place orders you're not confident about.
Short-term fluctuations are rapid, so it's essential to use stop-loss orders to avoid being repeatedly stopped out.
- Combining trend, position, and timing is far more reliable than blindly guessing by staring at candlestick charts.
This method is my "secret weapon" for consistently making profits over the past 6 years. Whether you can use it well depends on whether you are willing to look at more charts and summarize more.
Essential for cryptocurrency traders: 17 closing strategies – which one do you use? (A valuable resource) + Three-cycle resonance intraday trading system!
No matter how large the floating profit, it cannot be considered a true profit until the position is closed. Some may think that as long as a stop loss is moved to lock in profits, it is guaranteed. This is true most of the time, but it is not 100% effective, because prices can sometimes gap up (such as when news is released), and the stop loss may not be triggered.
If you pay attention to your surroundings, you'll notice that gaps can range from 50 points to even 250 points. As a result, many people close their positions before the market closes on Friday to avoid unnecessary losses. Of course, some people make good profits by taking advantage of these gaps, but most people lose money because of them.
Gaps are just a special case in the process of closing positions; the most important question is how to maximize profits.
This article introduces 17 methods for closing positions. These methods serve only two purposes: reducing risk and locking in profits. Hopefully, you can find a method among them that suits your trading strategy.
1. Basic Strategy One (X1)
This is the most basic closing strategy, which is to set the stop loss and take profit at the same number of points.
Assumption: Both stop-loss and take-profit are 58 points. This type of trade has a high probability of occurring; opportunities arise almost daily. If this setup is maintained for every trade, a success rate exceeding 50% will lead to long-term profitability.
2. Basic Strategy Two (X2)
The principle is the same as the previous strategy, but this time the take-profit is set at twice the stop-loss level.
For example: the stop loss is 58 points, and the take profit is 58 * 2 = 116 points. When the profit reaches 58 points, move the stop loss to the entry position, so the risk of this trade is zero. However, be careful not to move the stop loss too early, so as not to be stopped out by a slight pullback.
There are many opportunities for this type of trading, and a long-term success rate of 40% is sufficient to generate profits.
3. Basic Strategy Three (X3)
As you may have already guessed, the profit target this time is three times the stop-loss amount.
In long-term trading, such opportunities are relatively rare, unless you use a reversal trading system, which means opening a position when the trend begins to reverse. At this point, the stop loss is not large, and it is easier to take profit three times the initial investment. When the profit and the stop loss are equal, the stop loss is moved to the position where the position was opened. Such trading can be profitable with a success rate of only 20% to 25%.
4. Basic trailing stop loss
Trailing stops are a good way to minimize losses and lock in profits, but all brokers require that a trailing stop be activated only after the price has moved a certain number of points in the favorable direction. Here's an example:
For example, the sell order's opening price is 1.5887, and the stop-loss price is 1.5917, with a stop-loss of 30 points. Some brokers require a trailing stop of at least 30 points, so when the price drops to 1.5857, the stop-loss is moved to the opening price of 1.5887, at which point the trailing stop is officially activated. Of course, most brokers require a much lower number of points.
Using a trailing stop-loss order to close a position allows for locking in profits while leaving enough room to avoid being stopped out by minor market fluctuations.
5. Stop loss at support/resistance levels
Use the most recent support or resistance level as the initial stop-loss level. When a new support or resistance level appears, move the stop-loss to the new position until the position is closed at the stop-loss level. This method can generate substantial profits when the market is trending.
6. Oscillation-based trailing stop loss
The basic principle of this strategy is the same as support/resistance level trailing stop loss, the difference being that it uses a certain oscillator to find the support/resistance level.
Use the Stochastic indicator to find support (S) or resistance (R) levels; the other operating methods are the same.
Some oscillators can display additional support/resistance levels. The William %R indicator can also be added to the chart.
William%R's final resistance level moved the stop-loss order almost to the entry point, resulting in a profitable short position.
7. Fibonacci trailing stop loss
Most people use Fibonacci to open positions, but it can also be used to close positions.
The standard Fibonacci retracement is 0.382, 0.5, and 0.618, but you can also add your own custom retracement numbers.
A 20% retracement has been added to the chart. When using Fibonacci trailing stop loss, be careful not to set the retracement number too close to avoid being stopped out too early.
8. Single moving average
Moving averages are one of the most commonly used indicators, and most people use them to open positions, but they can also be used to close positions. There are countless options for the time period of a moving average, and it is up to you to decide which value to use when trading.
Using moving averages to trail stop-loss orders is incredibly effective when the market has a clear trend, but it's not as effective during consolidation periods.
If you choose too few timeframes, you may be stopped out too early; if you choose too many timeframes, the risk is too high. So the key is to choose a timeframe that is suitable for any market in your trading plan.
9. Crossover Moving Average
Using two moving averages is more complex than using a single one, and the key to success is choosing the right number of time periods.
Closing a position when two moving averages cross can capture the entire trend, but it's less effective during consolidation periods.
You can also use a different closing strategy at the beginning, and then use the cross-moving average strategy when the stop loss is moved to the opening position.
Remember, a single large profit can not only offset multiple small losses, but may also leave a surplus.
10. Fractal Indices
Fractal indicators are one of the best tools for setting trailing stop-loss orders, as they can display many mini support/resistance levels.
Setting stop-loss orders at these levels may result in earlier stop-loss triggers, but the risk is low and it increases the success rate.
Another approach is to use a different closing strategy when opening a position, and then use fractal indicators when the stop loss is moved to the opening position.

11. Bollinger Bands
The very popular Bollinger Bands have a variety of uses, including using them to close out positions.
When placing a long order (Long), you can wait for the candlestick to touch the upper band and close below the upper band, then place a trailing stop-loss order at the lowest price of that candlestick. If it is not triggered, place another stop-loss order at the lowest price of the next candlestick, until the position is closed.
Short positions operate in the same way, only in the opposite direction.
12. Kentner belt
Kentner bands and Bollinger bands are somewhat similar, but their calculation methods are completely different.
Using the Kentner bands to close positions also involves waiting for the price to touch the upper or lower bands, but there are significant differences. The probability of the price touching the upper or lower bands of the Kentner bands is not high, but once it does, it indicates that a reversal is about to occur, so you should immediately move your stop loss or close the position.
The actual closing procedure is exactly the same as using Bollinger Bands. Depending on the bullish or bearish direction, when the K-line touches the upper or lower band, move the stop loss to the lowest or highest price until the stop loss is triggered and the position is closed.
Kentner's closing strategy can be combined with other closing strategies to maximize profits.
13. High/Low Zone
The high/low band is drawn using the highest and lowest prices of the previous candlesticks. Alternatively, the high/low band can be drawn using the previous two candlesticks, the previous three candlesticks, or any number of previous candlesticks.
High/low bands are an excellent method for closing positions, and they are very profitable.
14. Trend Line
Using trend lines to close positions can result in quick entry and exit, or it can capture the entire trend.
When using trend lines to close positions, you may encounter false breakouts. Therefore, it is best to close positions when there are at least two candlesticks whose closing prices break through the trend line.
15. ADX indicator
ADX can be used alone, but it is more accurate when used with other indicators, such as the Stochastic Oscillator.
16. Parabolic Reversal Indicator
Many people try to design a trading system using this indicator, but few succeed. However, it is quite ideal for trailing stop-loss orders. The default value for the indicator's step parameter is 0.02; the larger this value, the closer it is to the price trend.
17. Deviation
Many professional traders like to use divergence in their trading because divergence can predict future market trends.
There are many types of divergence, and many indicators can also show divergence phenomena. This closing strategy uses the stochastic oscillator with parameters of 10, 3, and 5.
When divergence begins to appear, it's time to prepare to close your position.
Of course, you can also consider opening a position in the opposite direction while closing your position.
Three-cycle resonance intraday trading system!
Whether you're day trading, short-term trading, or medium-term trading, you need to establish an effective system. This is especially true for day trading, where a comprehensive system is even more crucial. For day trading, I most often use hourly, 15-minute, and 5-minute candlestick charts. The best entry point is when the trends of at least three timeframes converge.
For example, when the hourly chart, the 15-minute chart, and the 5-minute chart all show a bullish alignment, forming a technical pattern of three trends resonating, the short-term trend is bullish, and the trading strategy is to go long or buy on dips.
Based on the principle that a large-scale upward trend cannot be sustained without corresponding smaller-scale upward movement, and vice versa, a sustained upward trend cannot form if the moving average systems across three timeframes do not resonate with an upward trend. The same logic applies to short selling. Longer timeframes determine shorter timeframes, and shorter timeframes influence longer timeframes.
When trading, it is essential to follow the principle of "finding market direction from larger timeframes and waiting for entry signals on smaller timeframes." Generally, when doing intraday short-term trading, you must first correctly determine the trend on the hourly chart, and then wait for a trend resonance signal on the 5-minute or 15-minute timeframe as the entry point.
As long as the hourly moving average system forms a bullish alignment, the intraday short-term trend is one of oscillating upward movement. Subsequently, if a bullish trend resonates on the 5-minute chart, a small long position can be initiated. If a bullish trend resonates on the 15-minute chart, more positions can be added. After entering a long position, it can be held as long as the hourly trend remains unchanged. However, if the hourly candlestick falls below the low of the previous candlestick, profit-taking must be taken decisively. The same logic applies to shorting.
Why should we start by observing trend changes or finding entry points using a 5-minute trend chart?
Generally, trends in larger timeframes change very slowly. Once an hourly trend is established, the 15-minute trend will typically continue for a considerable period. Conversely, once a 15-minute trend is established, the 5-minute trend will likely continue for a significant time as well.
However, if the 5-minute trend changes, it's necessary to assess its impact on the 15-minute trend based on the magnitude of the pullback or rebound in the 5-minute chart. Conversely, observe the magnitude of the pullback or rebound in the 15-minute chart to determine its impact on the hourly trend.
Anything that exceeds a certain limit will cause a qualitative change from a quantitative change. Once the pullback or rebound exceeds a certain range, it will cause a change in the trend.
A change in a major cycle trend requires repeated oscillations in minor cycle trends. The formation and change of market trends always begin with changes in minor cycle trends, gradually pushing towards the major cycle trend, but this evolutionary process takes time. "Weekly charts represent the overall direction, daily charts represent major price swings." Trends formed on weekly charts are relatively stable; each round of price movements, rising or falling by a thousand points, is determined by the trend established on the weekly chart.
If the weekly trend enters an upward phase, the daily chart will show several weeks of consecutive upward movement; if the weekly trend enters a downward phase, the daily chart will show several weeks of consecutive downward movement.
However, because the longer the period of a candlestick chart, the greater the amplitude of a single candlestick, insufficient capital simply cannot withstand such large fluctuations. Therefore, when choosing which period of candlestick chart to use as a reference for trading, we must consider both the stability of the period and the amount of capital we have.
If you have limited funds but choose to trade using longer-term candlestick charts, even though you're trading in the general market direction—a strategy called "following the trend"—a pullback in an uptrend or a rebound in a downtrend could easily devastate your account. Therefore, those with limited funds should generally focus on short-term trading and choose shorter-term candlestick charts.
My moving average system uses only three moving averages: a 99-day moving average for long-term trends, a 21-day moving average for medium-term trends, and a 5-day moving average for short-term trends. When selecting candlestick chart periods, I also focus on analyzing three periods: hourly candlestick charts for short-term trends, 15-minute candlestick charts for price patterns, and 5-minute candlestick charts for precise entry points.
Cryptocurrency players' secrets: "game-changing" practical strategies
When you've outgrown the naive phase of "buying high and selling low" and think you're invincible in the crypto world, the real challenge quietly begins. At this point, more difficult than accurately predicting market movements is how to hold onto profits amidst wild volatility. Below, we share three fundamental "anti-routine" principles distilled from countless real-world experiences to help you transition from "not losing" to "making big profits":
I. Abandon the illusion of "absolute safety" and construct a multi-dimensional risk matrix
Mainstream cryptocurrencies are not invincible, and altcoins are not all traps. The key is to carefully define the limits for your positions and construct a scientific risk matrix:
- Core Asset Peg: 60% of the portfolio will be firmly pegged to "ecosystem hard currencies" like Bitcoin and Ethereum, with the holding period dynamically adjusted based on the key metric of active on-chain addresses. An increase in active on-chain addresses indicates more users participating in the cryptocurrency's ecosystem, boosting project popularity and development potential, thus justifying a longer holding period.
- Potential Sector Discovery: 30% of the funds are invested in leading projects in niche sectors supported by real-world application data. Taking a certain DeFi protocol as an example, when we observe that its total value locked (TVL) has steadily increased for three consecutive months, and the growth trend shows a healthy and sustainable state in on-chain data, it is a good time to enter the market.
II. Breaking through the limitations of digital profit-taking and capturing on-chain fund anomalies
Simply setting a profit-taking strategy of selling when you've made 50% is too simplistic in the complex world of cryptocurrency. The true profit-taking point lies hidden in the subtle changes in on-chain funds:
- Warning Signs of a Price Surge and Exit: When a cryptocurrency experiences a price surge, if the daily transaction volume of a major wallet address suddenly triples, it's highly likely that major funds are quietly withdrawing. At this point, even if the profit is only 10%, you should decisively reduce your holdings and lock in profits.
During periods of market volatility, an "intelligent grid strategy" is used to achieve automated arbitrage. Taking Bitcoin in the $30,000-$40,000 range as an example, using professional quantitative trading tools, the strategy automatically adds 5% to the position for every $500 drop and automatically reduces the position by 5% for every $500 rise. Through such high-frequency, small-volume trading, profit opportunities are captured during price fluctuations. Last year, this strategy yielded a considerable return of 23% during a period of sideways trading.
Remember, the key to advancing in the cryptocurrency market lies in using "uncertainty" to your advantage—hold firmly when the trend is clear, trade flexibly during periods of volatility, and decisively exit when risk signals appear.
There's a saying I wholeheartedly agree with: the boundaries of knowledge determine the boundaries of wealth; one can only earn wealth within the boundaries of their knowledge. A good mindset is crucial when trading cryptocurrencies. Don't let your blood pressure spike during a crash, and don't get carried away during a surge; securing profits is paramount. For those without abundant resources, a down-to-earth approach is the unshakeable way to survive.
I'm Little Egg Tart, a professional analyst and instructor, a mentor and friend on your investment journey! As an analyst, the most basic requirement is to help everyone make money. I'll help you resolve confusion, get out of trouble, and let my results speak for themselves. When you're lost and don't know what to do, follow Little Egg Tart; Little Egg Tart will guide you.
#美国非农数据超预期 $BTC


