⏰ Update at 9:13 on 08/08/2025
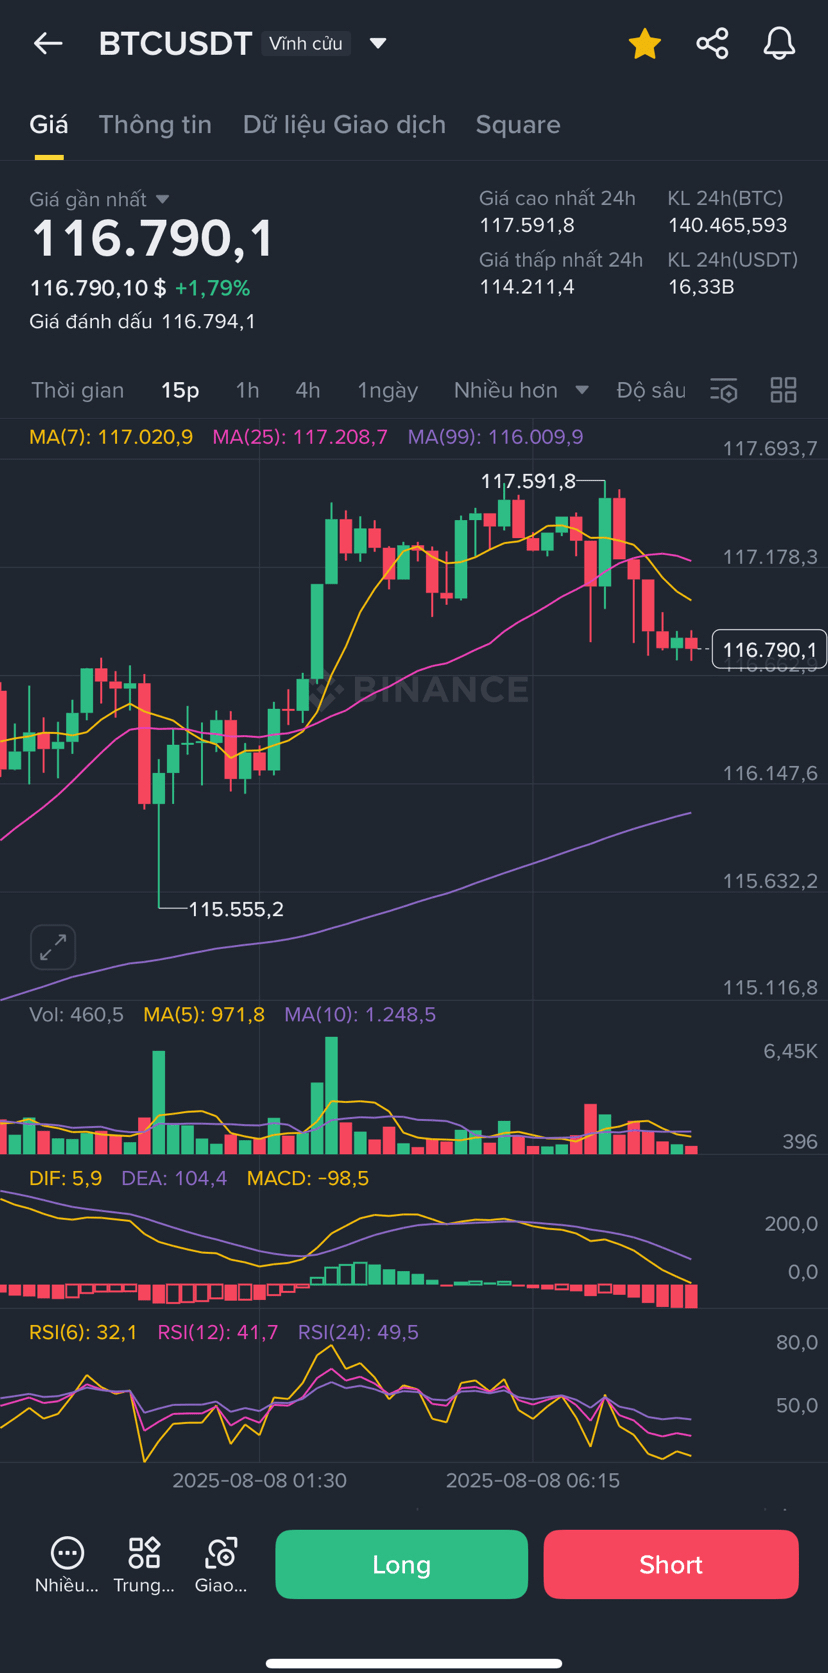
Observing the journey of $BTC lately, after a strong breakout from the area of 111,850 soaring straight to the peak of 117,591 like a flaming arrow, the market is now slightly quiet around 116,800. This adjustment is no different from a deep breath, a tactical retreat to gather strength before launching a new sprint. Let's carefully examine each timeframe to see if the 'big wave' is silently forming.
🕓 4h chart – Uptrend still holds, currently testing important support.
On the 4h chart, BTC has surpassed MA99 and maintained above both MA7 and MA25. The previous uptrend was very strong, creating a solid price base. Currently, the price is only slightly adjusting, still above MA7 (116,285) and MA25 (114,914) → the medium-term trend still leans towards an increase.
MACD is positive and expanding, indicating that buying power is still dominant. RSI(6) at 65.2 – a bit high but not signaling overbought yet.
=> I see this as an accumulation phase after a strong increase, as long as BTC holds above the range of 116,100 – 116,300, the uptrend remains safe.
⏱ 1h chart – Technical adjustment, waiting for a signal to bounce back.
On the 1h chart, BTC slightly decreased from the peak of 117,591 to around 116,800, currently sitting close to MA7 and above MA25 (116,090) → a nearby support zone.
RSI(6) at 47.8 – not weak yet, still room for a rebound. MACD is slightly negative but close to the zero line, selling pressure seems to have paused.
=> If it holds above 116,100 and surpasses 117,000, BTC could quickly return to test the peak of 117,591.
🕒 15m chart – Fluctuating but signs of a short-term bottom have appeared.
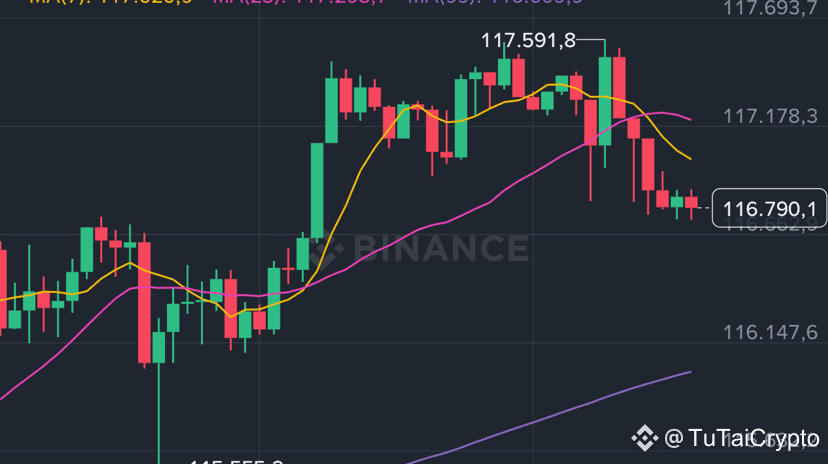
On the 15-minute chart, BTC has formed many long wick candles around 116,700 – 116,800, indicating that buying at the bottom is returning.
RSI(6) at 32.1 – close to the oversold zone, easy to trigger a rebound. MACD is still negative but is narrowing, signaling weakening selling pressure.
=> This could be a short-term launchpad. If the price holds above 116,800 and surpasses 117,000, the rebound will be clearer.
📌 Summary of personal view:
BTC is currently in a technical adjustment, but the medium-term uptrend remains intact. The 1h and 15m charts give gradual recovery signals, especially if it holds above 116,100 – 116,300.
🎯 Personal setup (Long):
Entry: 116,200 – 116,400
Stop Loss: 115,700 (below MA25 on the 1h chart)
TP1: 117,000
TP2: 117,590 (previous peak)
TP3: 118,200 if there is a strong breakout.
📌 Order management: When TP1 is reached, move SL to breakeven to reduce risk.
🚀 The scenario I am monitoring:
🔸 Bull case: Holding above 116,100 and surpassing 117,000 → retesting 117,590, even 118,200.
🔸 Bear case: Losing 115,700 → retreating deep to 114,800 (MA99 on the 4h chart).
👇 What about you holding BTC? Waiting for a breakout to buy more or taking temporary profits? Please comment and share!
👉 I mainly trade on Binance – newcomers can use the link below to permanently reduce trading fees (and support me a bit): thank you all very much.
Invitation code: GRO_20338_SMYIM
👉 https://www.binance.com/referral/earn-together/refer-in-hotsummer/claim?hl=vi&ref=GRO_20338_SMYIM