Is a Sharp Pullback Coming?
Recent Price Action & Technical Patterns
Solana has been trading within an ascending wedge (a typically bearish formation) since May. A breakdown could drop the price to around $155, while a breakout might drive it to new highs.
Recently, SOL bounced off the $190–$195 support zone and is now near $204, with resistance around $210–$215. A successful breakout could lift it toward $225–$230.
Profit-taking spikes at prior highs (e.g., $213) have led to pullbacks—suggesting that nearby resistance may trigger another retreat.
A sharp rejection near $213 saw SOL fall below $200, trading between $195–$198. Bearish signals on the MACD and RSI point toward deeper retracement risks, with potential support zones at $190–$192 and then $185.
Short-term technicals from CoinStats show resistance at ~$192.32, with a possible pullback toward $185. Bullish forecasts anticipate up to $215–$220, or even reconnection with all-time highs if $230 breaks.
Strong resistance around $200–$210 remains. Failure to break higher could lead to a retest as low as $150, though a breakout could fuel a powerful upward move.
Immediate market structure: SOL is holding above key EMAs and is range-bound between $195–$202, with downside risks to $174–$175, or even $150, if selling pressure intensifies. On the upside, breaking $205–$215 could open the path to $230–$240.
On deeper pullbacks: SOL dipping into the $150–$160 demand zone could represent a healthy retest, especially with institutional futures interest rising. If buyers defend that area and push above $170.4, a rebound toward $180–$206 could follow.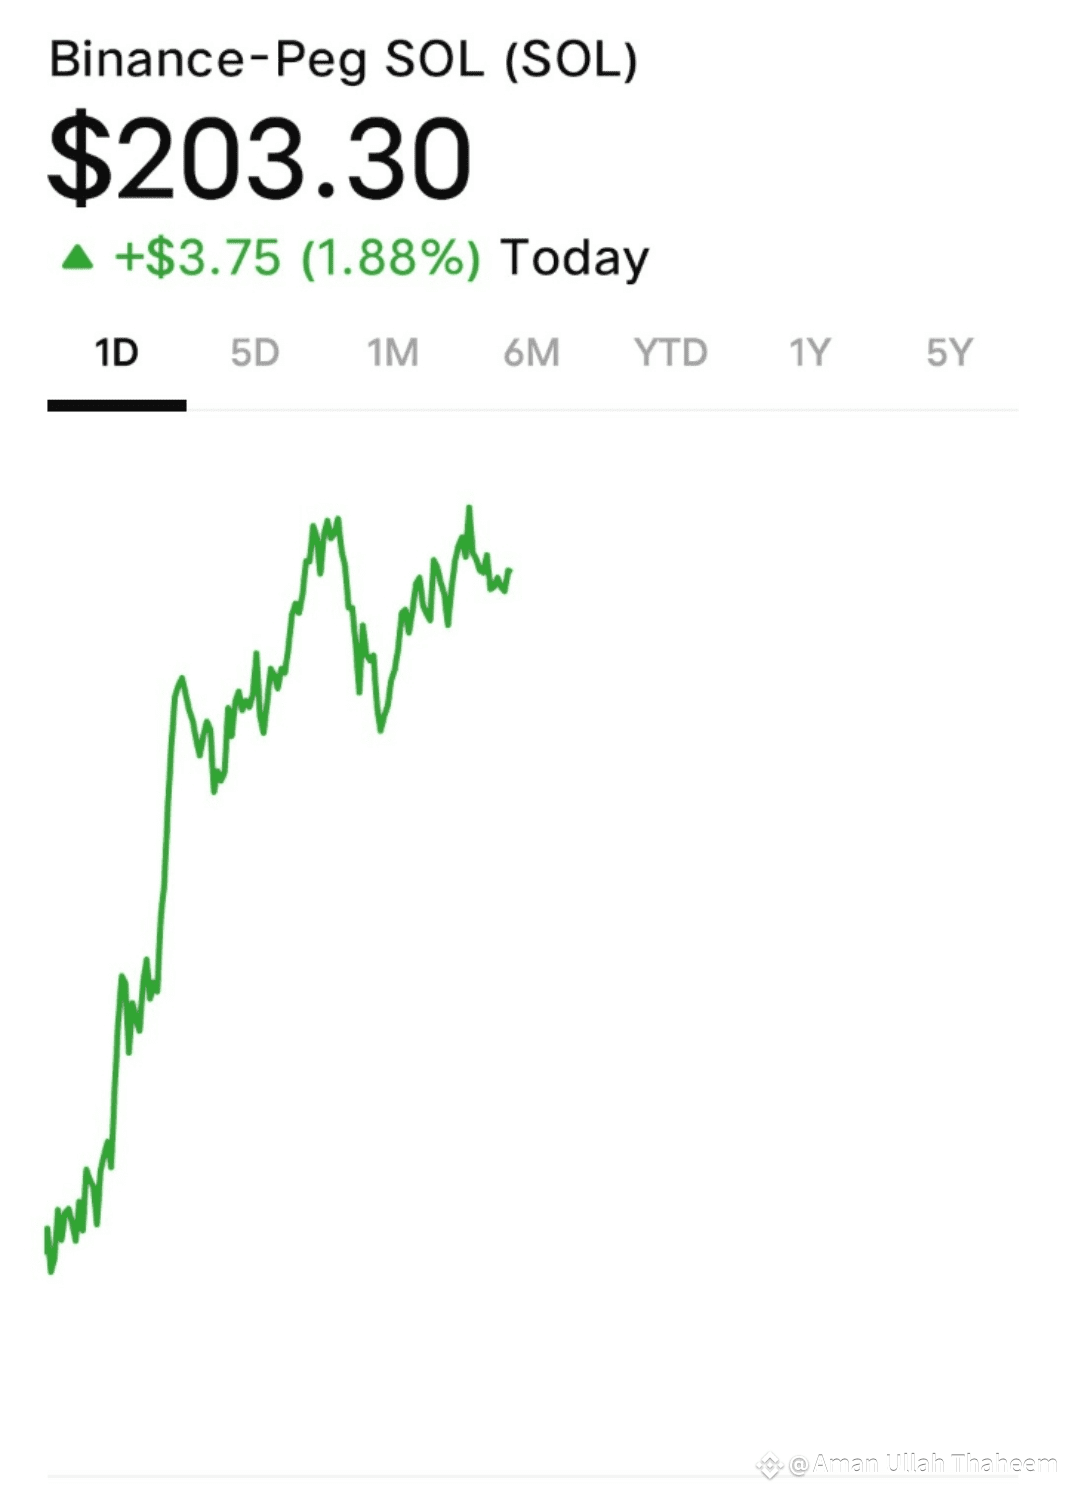 $SOL
$SOL
