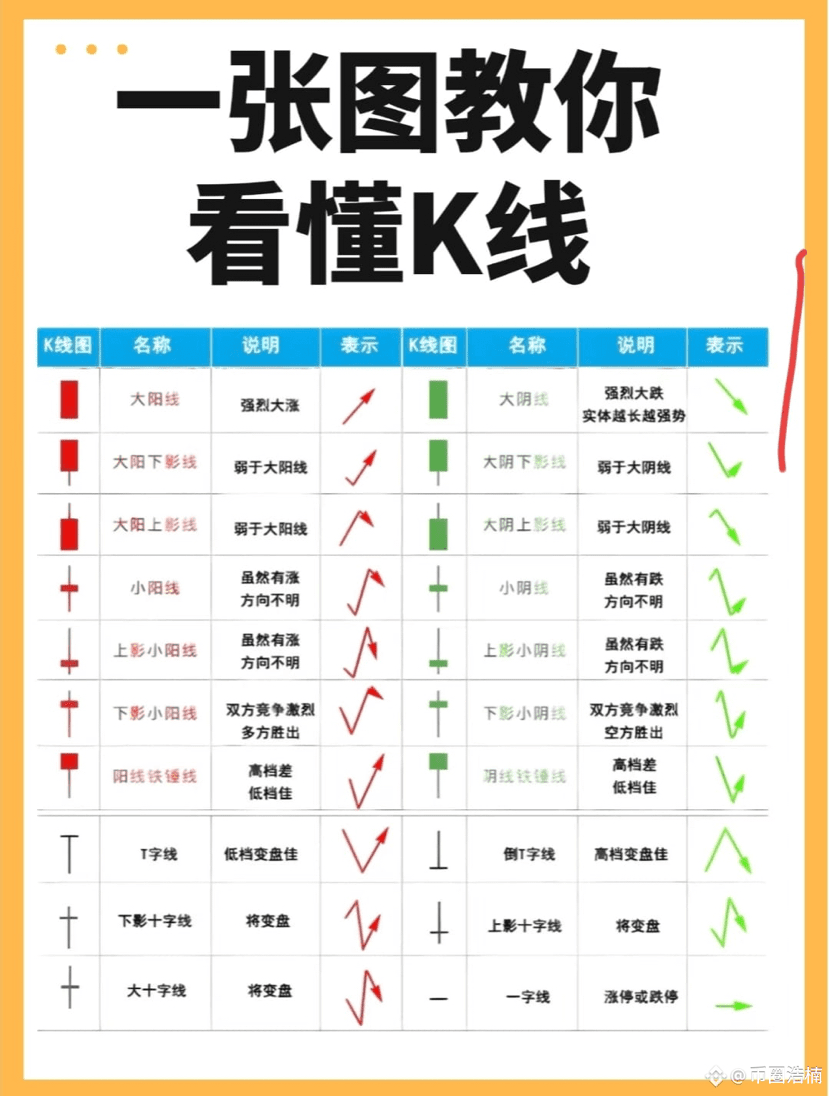
[Star R] The basic composition of candlesticks
Opening price: The first transaction price of the trading day.
Closing price: The last transaction price of the trading day.
Highest price: The highest transaction price during the trading day. Lowest price: The lowest transaction price during the trading day. A candlestick typically consists of three parts:
Upper shadow: Located above the candlestick, indicating the price range between the highest price and the closing price (or opening price, depending on the candlestick's color).
Body: Indicates the price range between the opening price and the closing price. A bullish candlestick (red or white) indicates that the closing price is higher than the opening price, while a bearish candlestick (green or black) indicates that the closing price is lower than the opening price.
Lower shadow: Located below the K-line, it indicates the price range between the lowest price and the opening price (or closing price, depending on the bullish or bearish nature of the K-line).
[Star R] Interpretation of K-lines: Single K-line interpretation, Bullish and Bearish: A bullish line indicates that the market has risen during this period, while a bearish line indicates a decline. Size of the body: The longer the body, the stronger the market's attack. A longer bullish body indicates more upward momentum; a longer bearish body indicates greater downward momentum. Length of the shadow: The longer the shadow, the stronger the resistance or support in that direction. A longer upper shadow indicates greater resistance to upward movement; a longer lower shadow indicates stronger support. Interpretation of K-line combinations: Double bottom and double top: A double bottom (W bottom) signals a transition from a decline to an increase in the market; a double top (M head) signals a transition from an increase to a decline. Head and shoulders bottom and head and shoulders top: The head and shoulders bottom is a pattern of market reversal to the upside, while the head and shoulders top is a pattern of market reversal to the downside.
Pregnant Line: The pregnant line usually indicates that the market may soon reverse.
Doji: A doji indicates that the opening price and closing price are the same during this period, and the forces of buyers and sellers are balanced. Appearing at a high position may indicate a peak, while appearing at a low position may indicate a bottom.
Red Three Soldiers and Three Black Crows: Red three soldiers are three consecutive bullish lines, indicating a strong upward market; three black crows are three consecutive bearish lines, indicating a weak downward market. However, it is important to note that three black crows during an upward trend may represent the accumulation of energy by the bulls.
Combining position and volume
