Bitcoin (BTC) is trading at $116,920 USDT, showing a +1.30% increase in the last 24 hours. Market sentiment remains positive as BTC approaches the $117,000 resistance zone.
📈 Price Action
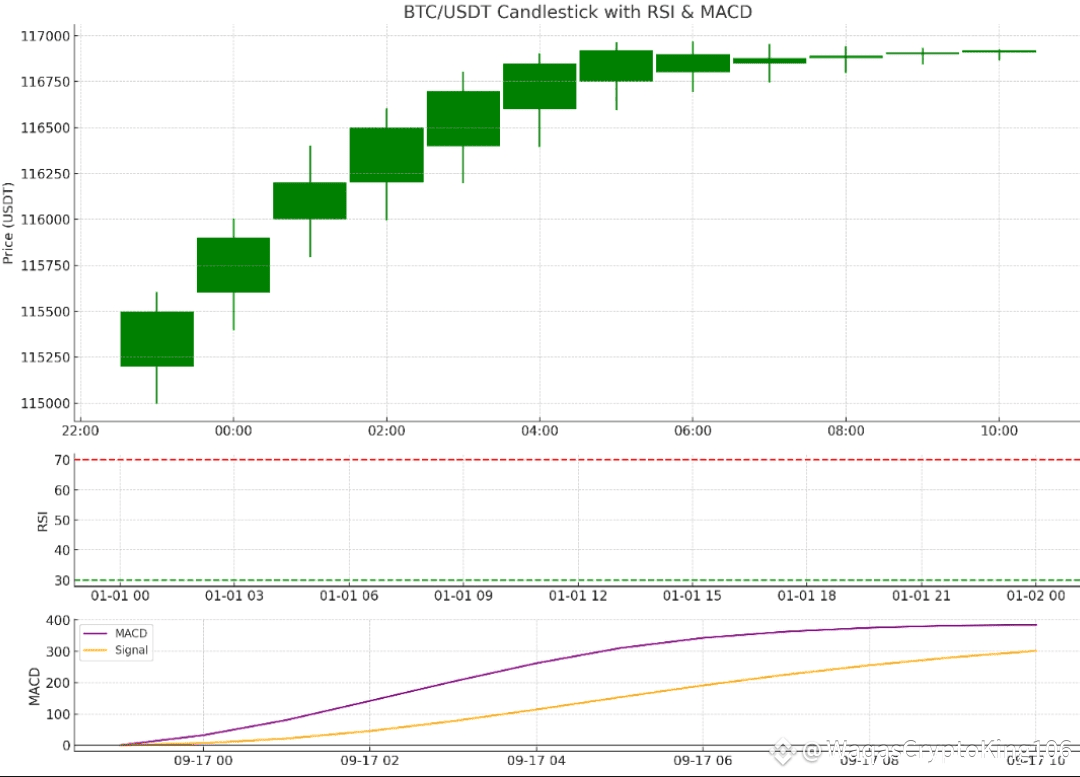
24h High: $116,964
24h Low: $114,737
Trend: $BTC has been climbing steadily, consolidating above its 60-day moving average (MA60: $116,745).
Recent candlesticks show a strong bullish rally followed by small-bodied candles with wicks — signaling momentum slowdown and profit-taking near resistance.
📊 Technical Indicators
Moving Averages (MA): Price remains above short- and long-term MAs, reinforcing a bullish bias.
Volume: A noticeable spike in buy volume around 01:00 UTC suggests strong accumulation by buyers.
Order Book: 79.65% buy orders vs. 20.35% sell orders confirm strong bullish sentiment.
RSI & MACD (from chart tools):
RSI indicates near overbought conditions, which may lead to short-term pullbacks.
MACD remains in bullish territory, supporting further upside if momentum continues.
🏷️ Support & Resistance
Immediate Support: $116,700
Strong Support: $114,700
Resistance Zone: $116,960 – $117,200
Breakout Level: Above $117,200, BTC may test $118,000+.
📌 Outlook
Bitcoin is in a bullish consolidation phase. As long as BTC holds above $116,700, buyers remain in control. However, a failure to break $117,000 convincingly could lead to a pullback toward $116,500–$114,700 before the next leg up.
✅ Conclusion:
$BTC /USDT is showing strong upward momentum but faces critical resistance near $117K. A breakout above this level could spark fresh highs, while rejection may trigger short-term corrections.