
The behavior of big players $BTC diverges from the actions of mid-term investors. These two groups are using completely different strategies. The price action of the cryptocurrency hides the real situation in the market.
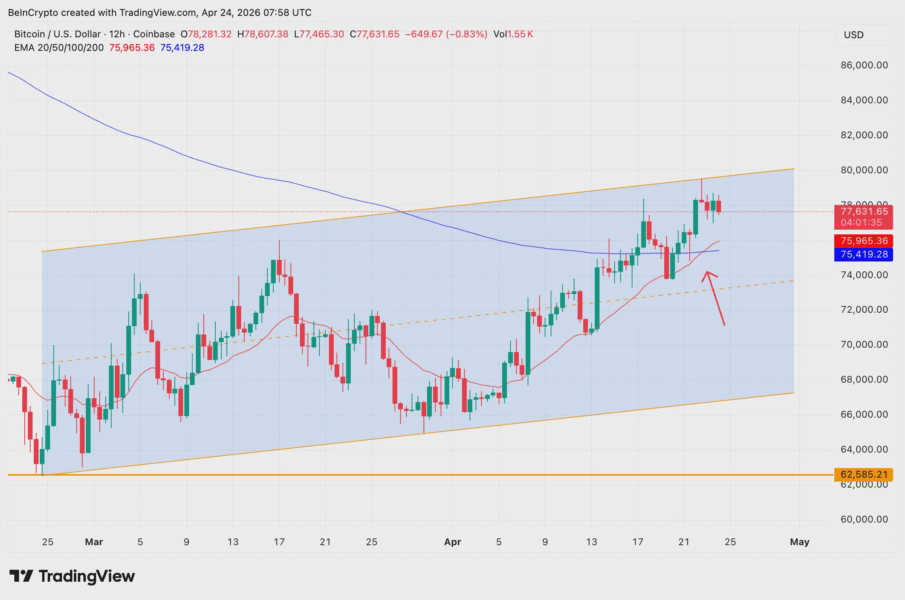
The coin is trading at $77,670 as of April 24. The asset is inside an upward channel. This trend has formed on the candlestick chart since February 24. A bounce back above the $77,000 mark looks like a bullish signal. However, on-chain data shows a conflicting picture. This discrepancy helps to understand the true motives of the big players.
Triggers for scaling up positions
A group of investors with balances from 10,000 to 100,000 $BTC act according to a clear pattern. They acquire assets at local lows. Market participants ride out the growth phase and halt purchases.
Data from Santiment shows a rapid increase in the reserves of this user category. Their balance rose from 2.26 million to 2.27 million coins in early February, just four days after the price fell below $62,000. A similar situation repeated in the spring when investors boosted their reserves from 2.23 million to 2.26 million bitcoins from March 23 to early April. At that time, the price reached a low of around $67,700. A new wave of purchases started on April 22.
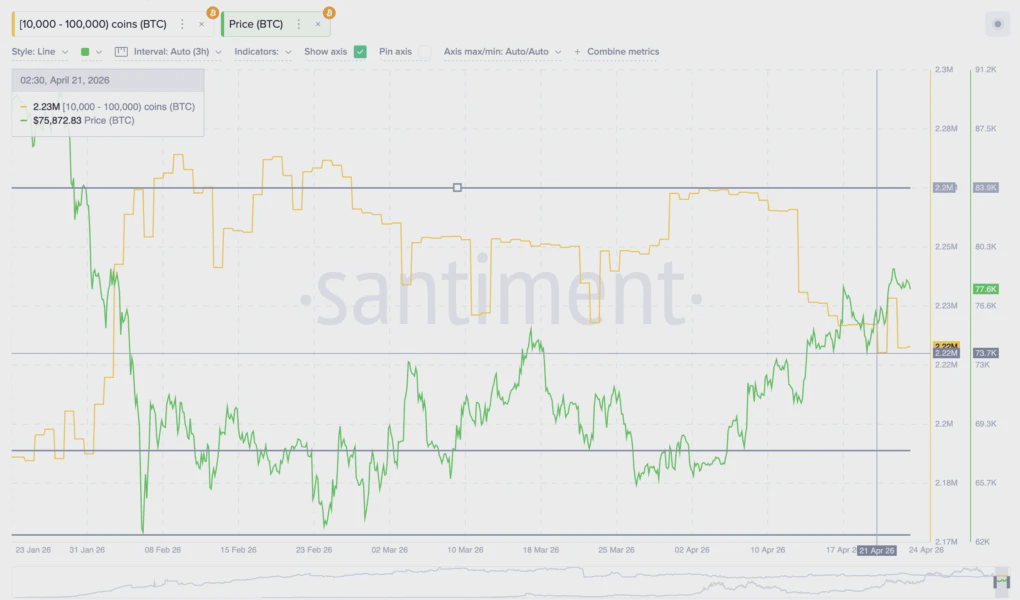
April trades had a technical basis — on the 12-hour chart, the 20-period exponential moving average (EEMA) crossed above the 200-period EMA from below. This crossover occurred on the day buyer activity resumed, indicating a well-timed trading operation. Players seek short-term gains rather than betting on sustained growth.
ARK Invest's quarterly report adds to the overall picture. Major funds increased their assets by 69% in Q1 2026. Their holdings grew from 2.13 million to 3.60 million coins amid a 22% market dip. This is the highest accumulation rate since the 2020 cycle. Later, the asset's value rebounded after the fall.
Investors are currently making purchases at $77,000. The ARK Invest report mentions a level of $68,200. This confirms participants' interest in bounces rather than seeking an absolute market bottom.
Reduction in activity among medium-term holders
A sustainable market recovery requires participation from medium-term investors. Currently, they are not scaling up their positions.
The net position change metric from Glassnode tracks the balance of buying and selling among this user group. The metric peaked at 38,401 $BTC on April 21, when the coin's price was $76,470. By April 24, the value had dropped to 32,303. A 16% decline in three days indicates high caution. Confident investors aren't buying the asset during price bounces.
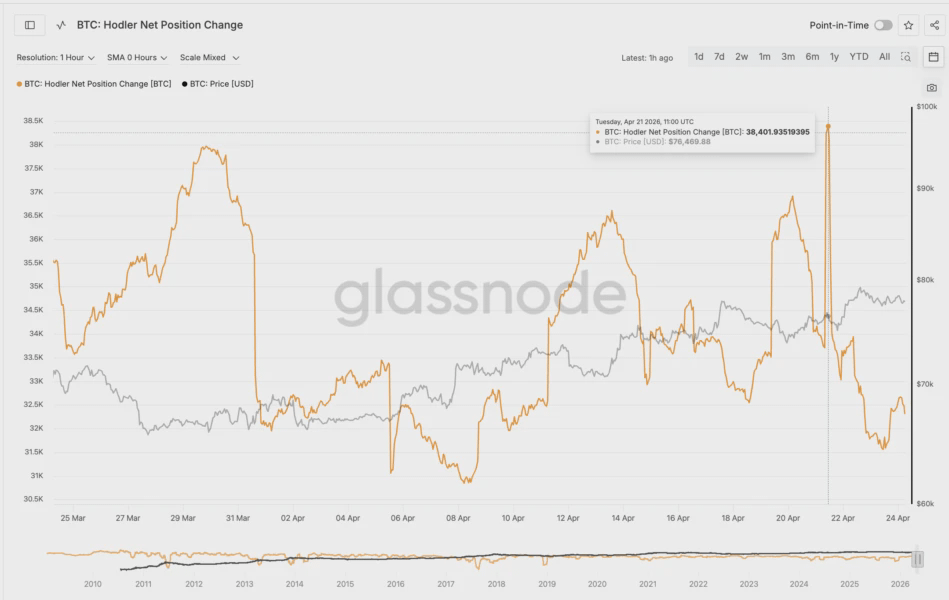
Such a reaction is due to the absence of a clear indicator of a market bottom. Analysts mentioned this factor in the previous review of Bitcoin's price dynamics.
Impact of the upper price channel boundary
Bitcoin hit the upper boundary of the bullish trend on April 22. The price rose to $79,528, after which a decline began. This retracement aligns perfectly with the actions of major players. The bullish momentum faced resistance at the trendline, which has held back all rallies since February — the price increase stalled without support from medium-term investors.
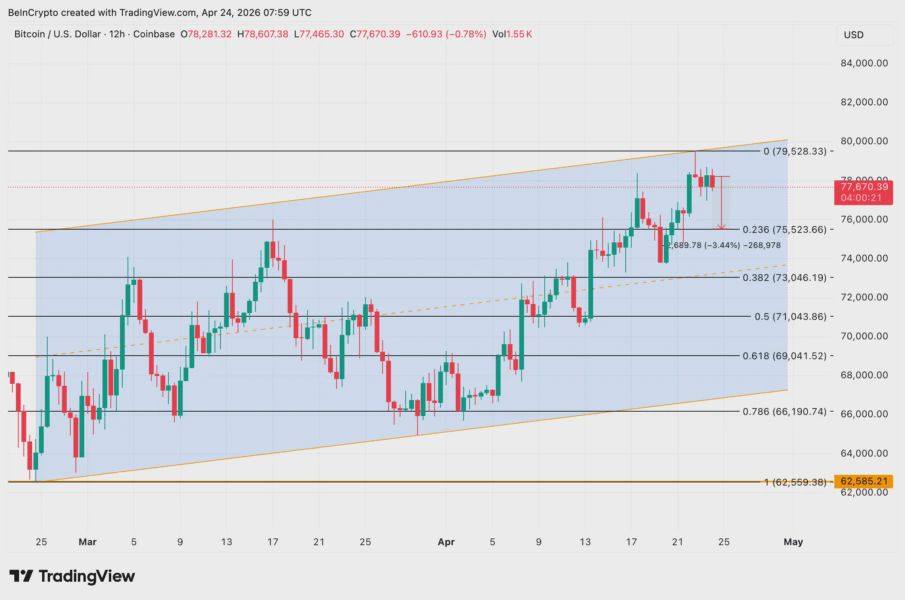
A daily close above $79,528 will change the market structure. This will open the path to the upper channel boundary near $80,000. Holder confidence may increase in light of such a breakout. Inability to overcome resistance raises the risk of a decline. The first test of strength will be the Fibonacci correction level of 0.236 at $75,523.
A breakout above $75,523 will pave the way for values around $73,046 and $71,043. A drop to the Fibonacci level of 0.786 near $66,190 will lead to a test of the lower channel boundary, which is close to the $62,559 mark. A 10% rise in January could quickly be negated if the current bounce shows weakness. For now, the $79,528 level separates a full breakout from another speculative wave.