
🔹BTC/USD – Bullish reversal from the main support
Bitcoin shows a strong reversal setup on the hourly chart after retesting the support area of $112,800, which acted as a strong demand zone. Buyers entered aggressively, forming a bullish reaction candle supported by an increase in volume, indicating the potential for a short-term recovery move.
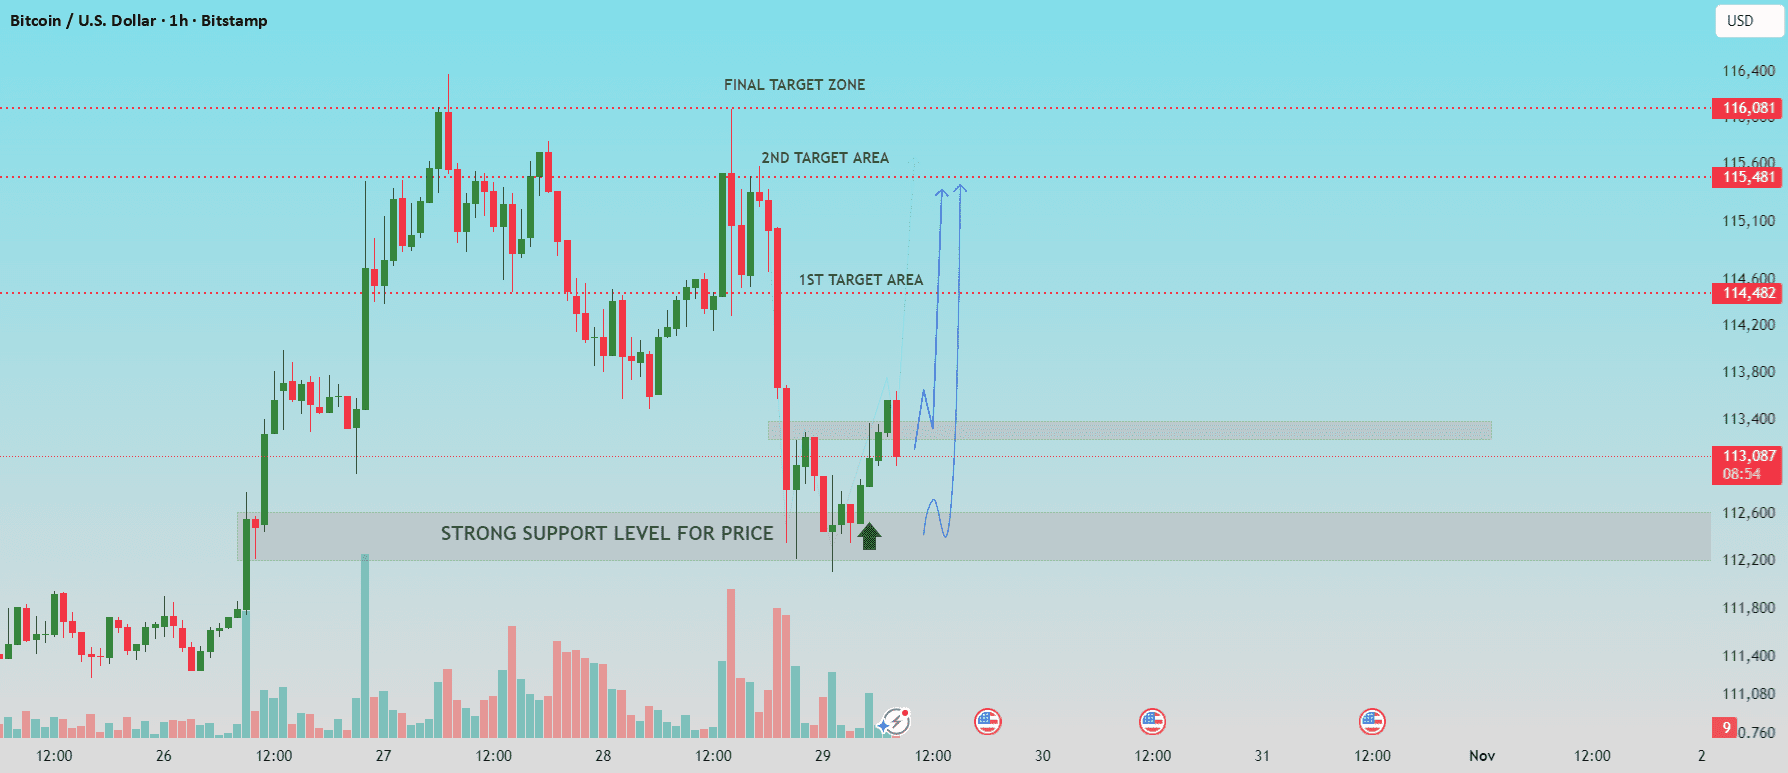
📊 Key levels to watch:
Strong support: $112,800 – $112,600
First target: $114,482
Second target: $115,481
Final target area: $116,153 – $116,400
💡 Technical outlook:
The price is currently trading around $113,437, building momentum above support. A sustained break and close above $114,000 could confirm the continuation of the upward trend towards the first and second target areas.
As long as the price remains above $112,800, the short-term trend remains bullish. A close below this level will invalidate the bullish setup and open the door to lower prices.
🎯 Trade idea (example)
Entry: $113,400 – $113,600
Stop loss: below $112,700
Take profit:
TP1: $114,482
TP2: $115,481
TP3: $116,153
Risk/Reward: 1:2.5 – 1:3
▪Summary:
Bitcoin is attempting to reverse the trend upward after testing strong support. If momentum continues, we could see a push towards levels $115K–$116K. Watch for confirmation above $114K before entering strongly.
If this was helpful to you, please hit the like button.
#CryptoBreakout #TrendlineResistance #CryptoAnalysis #bitcoin #BTC