


XRP regained momentum, rising above $2.50 on Monday.
The average investment product flows in XRP reached $28 million last week, indicating a return of risk-on sentiment.
The short-term technical picture is turning bullish, supported by a buy signal from the MACD indicator and the RSI heading upwards.
Ripple ($XRP ) rose alongside major cryptocurrencies, including Bitcoin ($BTC ) and Ethereum ($ETH ), trading above $2.50 at the time of writing on Monday. Short-term technical analysis and a return of risk-on sentiment bolster bullish expectations for XRP in the broader cryptocurrency market.
Increased inflows into the XRP fund, supporting the recovery
Digital asset investment products experienced outflows last week, except for a few selected coins, such as XRP, which recorded inflows, ignoring risk-on sentiment. According to CoinShares, the average inflow volume for XRP was $28 million last week, bringing total assets under management (AUM) to $2.4 billion.
In comparison, Bitcoin and Ethereum faced significant outflows of $932 million and $438 million, respectively. In total, digital asset investment products saw outflows of $1.17 billion. CoinShares reported that the outflows were due to "post-liquidity chain volatility and uncertainty regarding a potential interest rate cut in the U.S.".
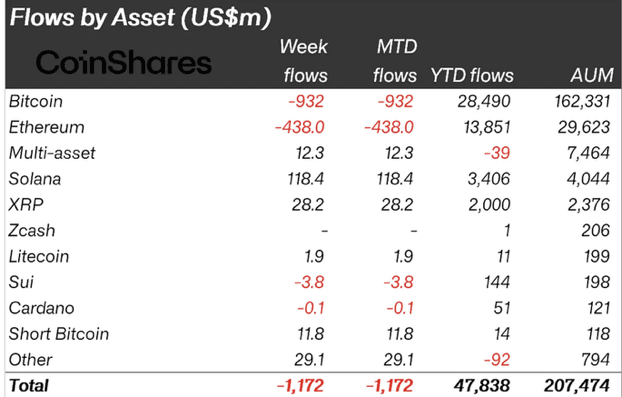
Digital asset investment product flows | Source: CoinShares
Meanwhile, retail demand for XRP remains relatively low, with open interest (OI) averaging $3.36 billion on Monday compared to $4.17 billion on November 7 and $9 billion, which was the peak level in October.
OI tracks the nominal value of outstanding futures contracts, which can be used to gauge investor interest. To maintain the bullish trend, more traders need to increase their risk exposure. Otherwise, low OI indicates that traders are not convinced that XRP can sustain the bullish trend in the short to medium term.
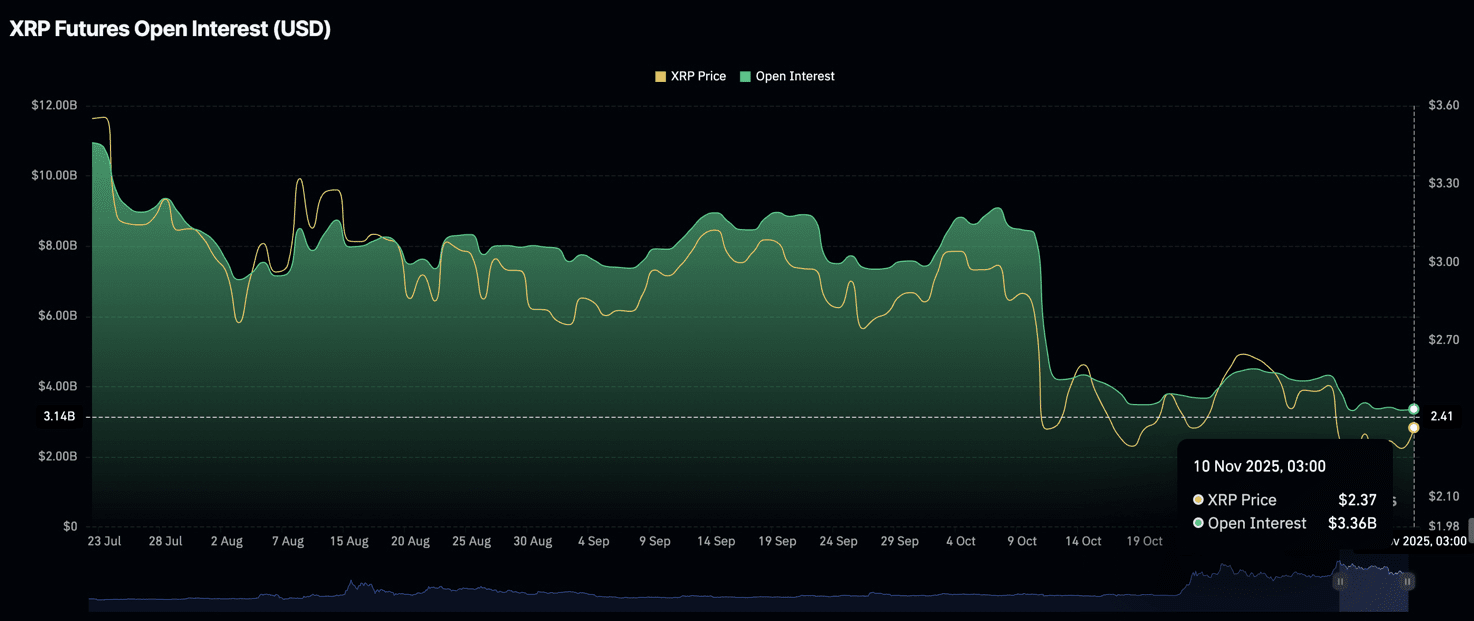
Open interest for XRP futures contracts | Source | CoinGlass
Technical outlook: Assessing XRP's recovery potential
XRP is trading above $2.50 at the time of writing on Monday after being rejected from the upward trend during the day at $2.57. The 200-period exponential moving average (EMA) provides initial support at $2.49 on the 4-hour chart, which may be useful if profit-taking continues to diminish the recovery.
The Relative Strength Index (RSI) is at 68 on the same daily chart, down from slightly overbought conditions at 71. If the RSI drops further, it will indicate a pullback in bullish momentum.
Traders will be watching for a daily close above the 50-day exponential moving average to determine bullish expectations for XRP, especially as the Moving Average Convergence Divergence (MACD) indicator continues to provide a buy signal on the daily chart since last Wednesday.
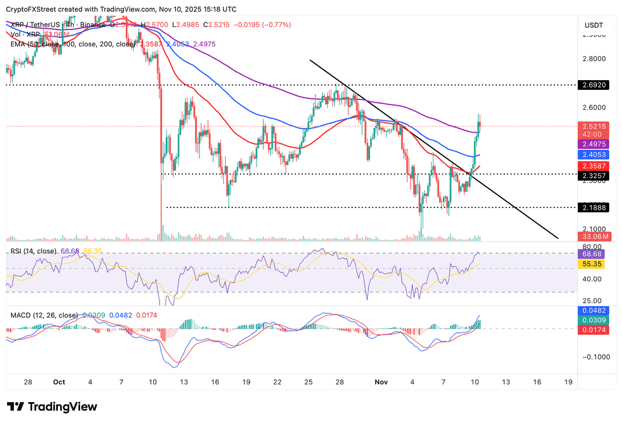
The daily chart for XRP/USDT
However, if supplies overwhelm demand due to declining retail demand in the derivatives market and profit-taking in the spot market, XRP may extend its decline below the 200-period exponential moving average towards the 100-period exponential moving average at $2.40.