
After a wave of strong panic selling was cleared, BTC welcomed the anticipated rebound. The speed of this rebound was faster than I expected; I originally thought it would take at least until next week to return above $90,000. It seems that both AI and I have to concede this time, but I'm still happy to lose.
The stabilization of prices has provided the market with a rare breather, especially after experiencing consecutive sell-offs. However, while we are happy, we must be clear that it is still far from the time to shout 'bull market'; the real test may still be ahead.
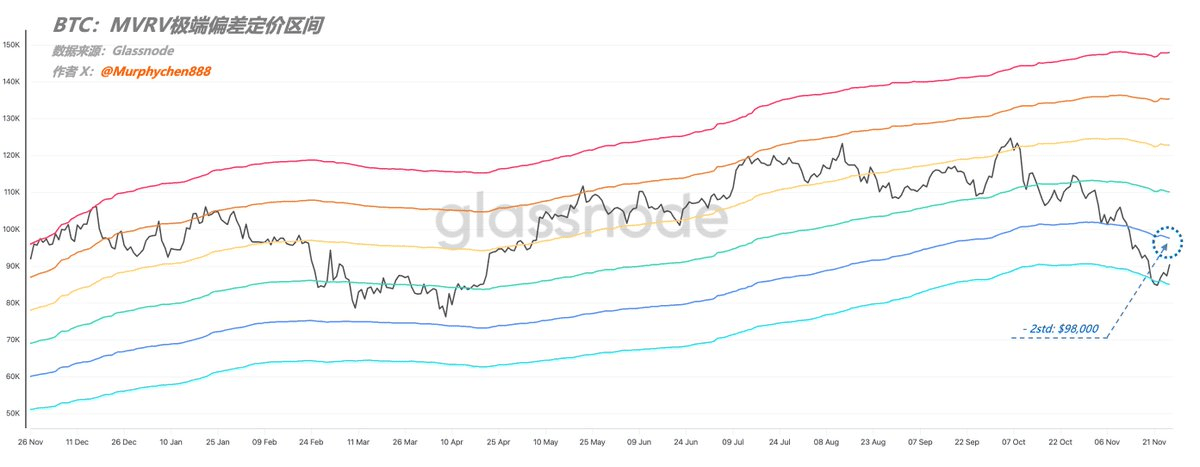
After rebounding from the support at the green line in the MVRV extreme deviation pricing range, BTC's first resistance level is the upper blue line, which is around - 2std = $98,000. Only if it stands above here and does not break below on a pullback can we consider it a short-term bottoming trend structure.
At the same time, $98,000 is also the historical fair price line for BTC (currently $99,000), which is the average premium of BTC relative to the average buying price throughout its history. The more the price exceeds the fair price, the larger the bubble of BTC, and vice versa indicates that it is in an undervalued range.
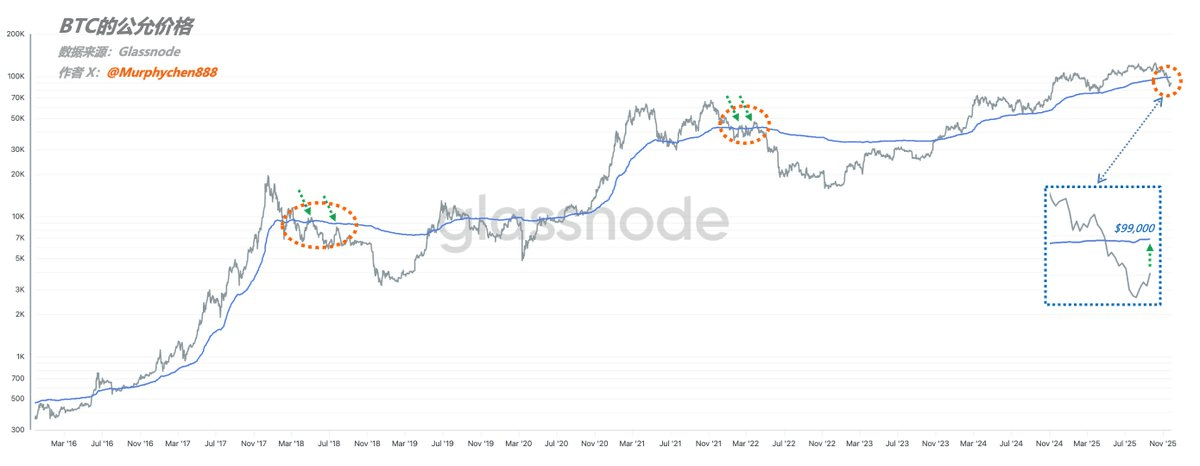
In the transitional phase of the first two cycles from bull to bear, BTC has always fallen below the fair price line, rebounding multiple times but unable to effectively stay above it, eventually entering a deep bear phase. This indicates a severe lack of market confidence, ignoring value return while placing more emphasis on risk aversion. Therefore, the core focus of this rebound is whether BTC can re-establish itself above this line.
We know that the current selling pressure comes from two aspects: firstly, the short-term high-position trapped chips, which are cutting losses under pressure, further exacerbating the fermentation of market panic sentiment. However, as long as the price performance transitions from rapid decline to oscillating downwards and then gradually stabilizes, this part of the selling pressure will gradually decrease, especially as we have already seen a wave of panic selling clear out on the 21st.
The second point is the selling of long-term profit chips. Even though BTC has retraced more than 30% from its high, most LTH still hold a large amount of floating profit chips. Under the influence of the traditional four-year bull-bear cycle theory, selling at the right time has become a trading discipline.
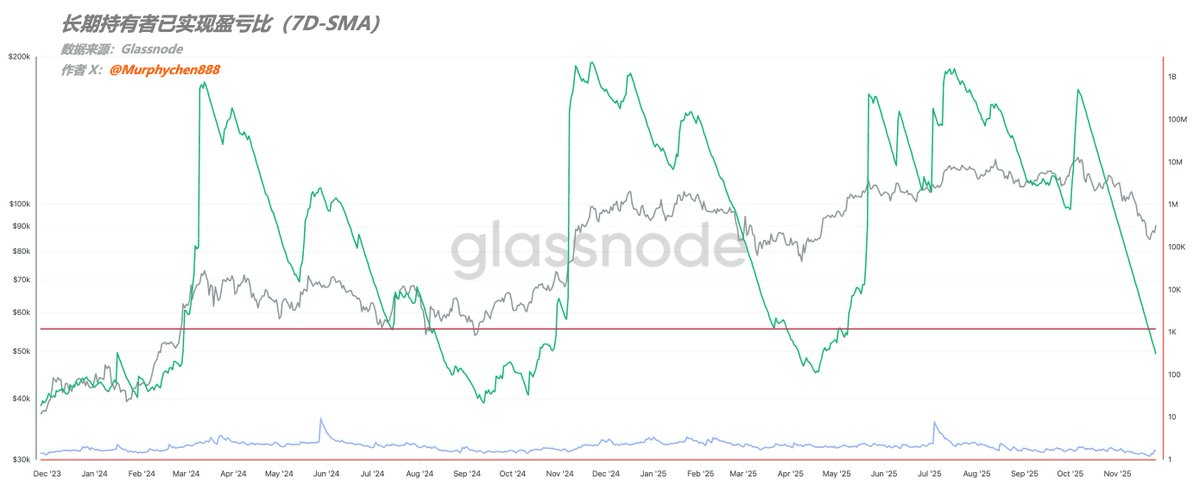
But now we see that as the price has pulled back, the realized profit-loss ratio of long-term holders has dropped below the red warning line (as shown in Figure 3), indicating that the profit space for long-term chips choosing to sell at this time is being compressed. Without objective profits, the motivation for LTH to sell is bound to decline. Therefore, this part of the selling pressure will gradually decrease.
Therefore, we hope to see the following process:
1 Price goes from a sharp decline to a gradual decline — 2 Panic sentiment eases — 3 Short-term chips decrease as people cut losses — 4 Panic further stabilizes — 5 LTH realizes the cycle is not over, begins to reduce profit-taking — 6 Market risk appetite increases — 7 New demand begins to enter.
The above seven steps are the necessary path to restoring the bull market structure, gradually transitioning from a death spiral to a virtuous cycle, with each step closely linked. Of course, achieving all of this ultimately requires time and patience.

