
On the CBD (Cost Basis Distribution) heatmap, we can clearly see how many chips have changed (increased/decreased) at what time and price range. For example, the current densest areas have two segments, namely $94,000-$98,000 and $101,000-$118,000, which represents the ranges where BTC will face resistance during the rebound.
Among them, $98,000 is the historical fair price (see yesterday's tweet), and $104,000 is the average cost of short-term holders. These two lines are the hardest reference lines to break in historical bull and bear sentiment switches. In other words, if broken, it can firmly indicate the trend as bullish/bearish.
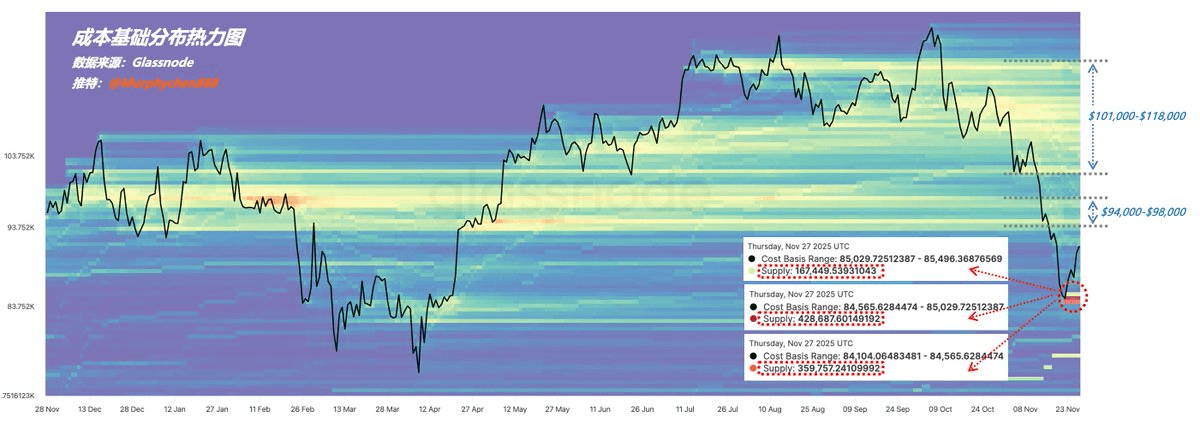
On this data, the most striking point is the sudden appearance of 'red' data bars around 84,000-85,000, indicating a significant accumulation of chips here. To make it easier for everyone to view, I have extracted it. The three positions combined accumulated a total of 950,000 BTC; the appearance time was during the days of 11/21-11/23.
However, this should include the data from Coinbase's wallet organization on the 22nd (approximately 550,000 BTC). Subtracting this portion, the remaining 400,000 BTC should be the real turnover. Obviously, this is not something retail investors can shake, so it is closely related to the presence of large whales during this time period, as we analyzed yesterday.

