$ETH
The daily chart shows that the market surged and then fell back, encountering resistance around the middle track. The previous candle closed with a long upper shadow and a bearish body. The intraday opening showed narrow fluctuations, and the Bollinger Bands are in a contracted state with short-term moving averages turning upwards. The MACD fast and slow lines crossed and are running upwards, with increasing volume. The KDJ is also moving upwards, showing signs of turning. The VR indicator is consolidating around the value of 50. Looking at the 4-hour chart, the market surged and then plunged back below the 7-day moving average. The Bollinger Bands are moving upwards, showing signs of contraction, and the short-term moving averages are turning. The MACD fast and slow lines crossed downwards, with the volume bars turning green and increasing. The KDJ is extending downwards, and the VR indicator is consolidating around the value of 80. Overall, the market's trend aligns with the expectations mentioned above. Currently, it continues to maintain high-level fluctuations, and the liquidity over the weekend is poor, which may result in limited volatility. In the short term, it remains primarily a rebound in the bearish trend. The focus should be on resistance around the previous highs, considering short-term recommendations.

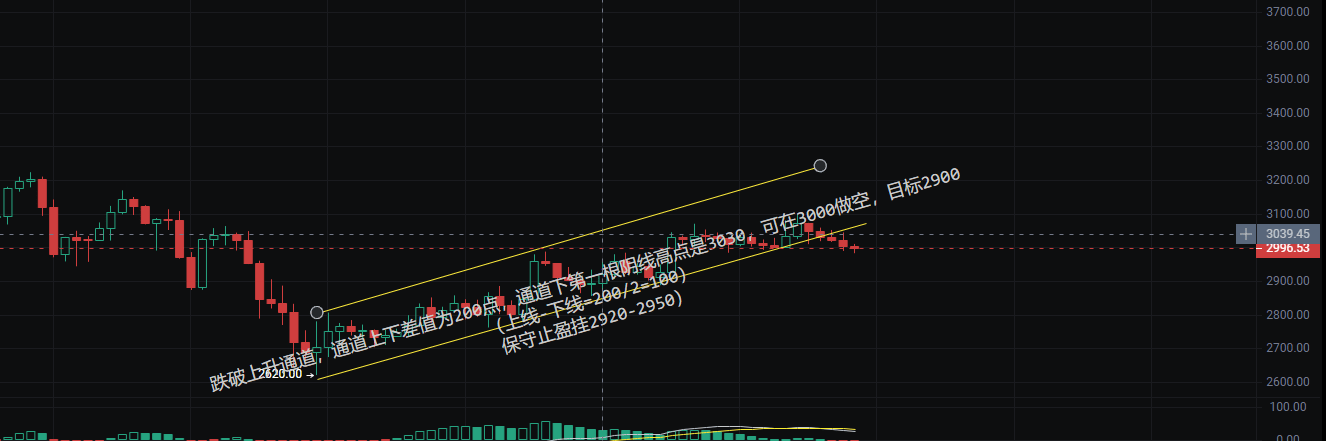
3030空 (Strategy activation has profits to manage on your own)