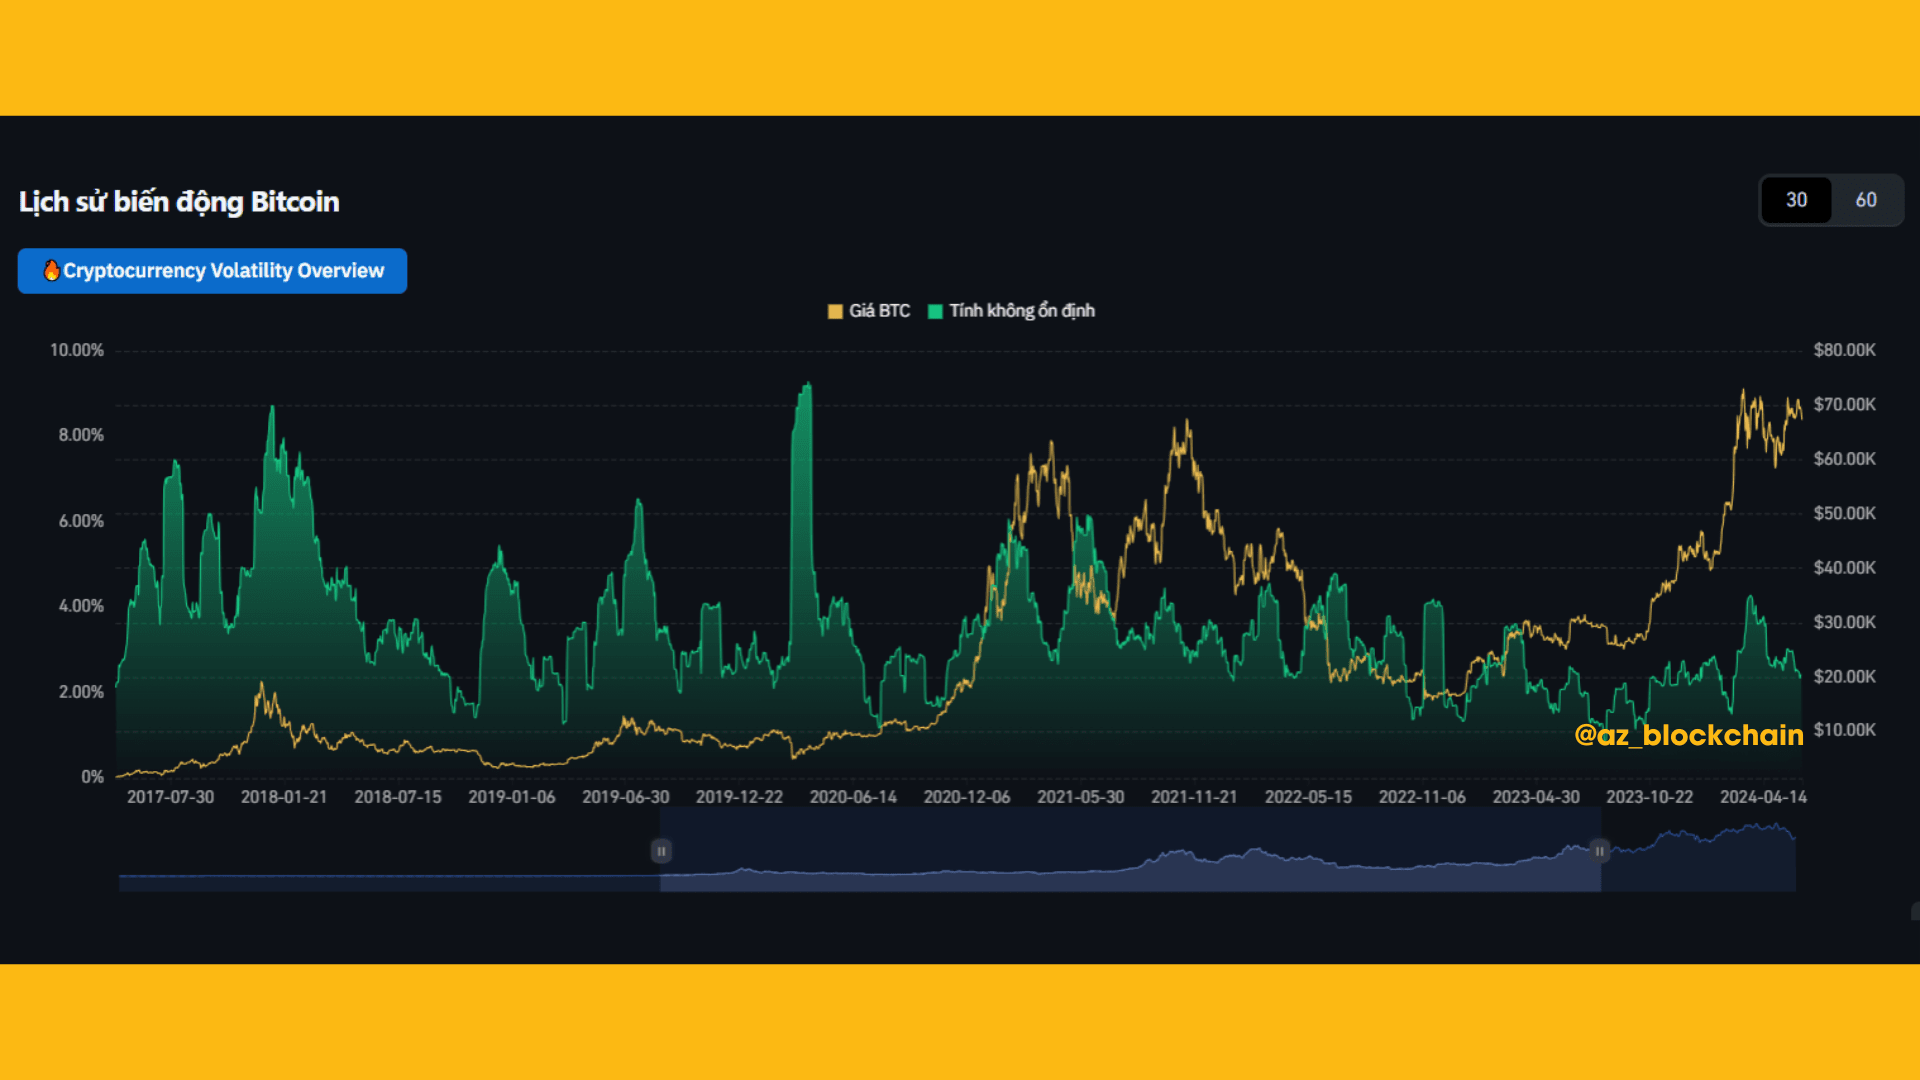
Historical volatility chart of Bitcoin, showing $BTC BTC fluctuating strongly or weakly over different periods. This is an important indicator to understand whether the market is hot, cold, or preparing to change trends.
📊 1. When volatility is HIGH → the market is chaotic, prices tend to spike/drop sharply
Areas with a sharp rise of 5%–10% usually appear in:
✨Bull run start → prices increase dramatically
✨Panic sell → the market panics, drops sharply
✨Historically, every strong volatility event has been accompanied by major trend changes.
✨Currently: Volatility is not too high, meaning the market is no longer too panicked but also not strongly FOMOing.

📉 2. When volatility is LOW → the market accumulates, preparing to choose a direction
The volatility zone “staying calm” below 2% is typically:
✨Prolonged sideways phase
✨Investors are waiting for big news
✨Big money is quietly accumulating
💠Interesting fact:
✨Before strong increases of $BTC (2017, 2020, 2023), volatility often decreases sharply beforehand → like “the calm before the storm”.
✨Now, the level of volatility is gradually decreasing → the market may be in an accumulation phase – waiting for the next push.
🔍 3. $BTC high price but low volatility → what signal?
✨This is a model that often appears in the first half of the upcycle.
✨This means the market is “stabilizing at a high price”, with no sign of a bubble.
💠Price is higher than the past but the trend remains stable, not a fake pump.
🧭 4. Overview perspective
✨Not the riskiest time (not high volatility).
✨It’s not yet the time for crazy FOMO (low–medium volatility).
✨The market is in a sideways state – accumulating – preparing for a big trend.
💠Suitable: DCA BTC/ETH, avoid leverage, limit buying risky altcoins.
🛑 THIS ARTICLE IS NOT INVESTMENT ADVICE, PLEASE REFER AND ALWAYS STAY CALM IN THE MARKET. 😘
#Bitcoin #Volatility #CryptoMarket #MarketUpdate #az_blockchain

