Intense battle between whales! Will ETH surge to 3640 or plummet to 2870? The 4-hour chart hides reversal signals; retail investors shouldn't choose the wrong side tonight! Watching the price of ETH soar, are you itching to enter? Hold on a minute. The market has just drawn a roadmap for us: 3640 is a formidable mountain ahead, and there's a tollbooth in between at 3370.
Let's first look at the news:
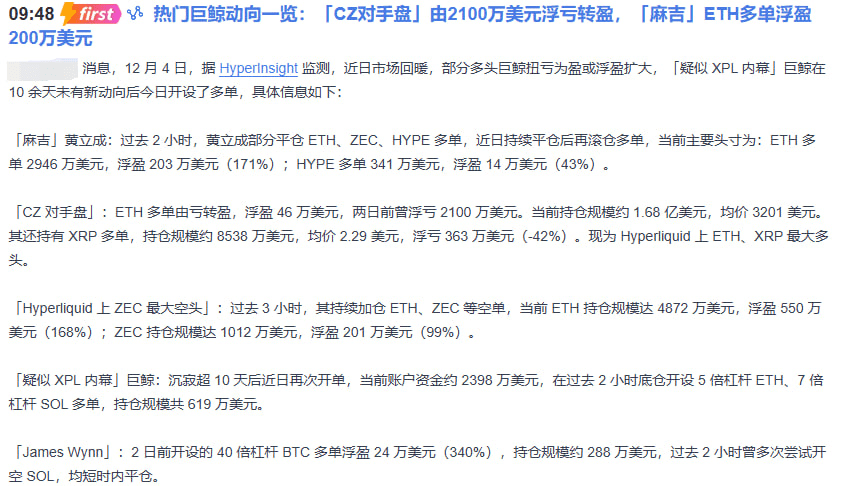
A whale has staged a remarkable comeback! According to HyperInsight monitoring, CZ's counterparty, a "whale," has shown astonishing performance in the past two days. Two days ago, it was down $21 million, but now its ETH long positions have a profit of $460,000, with a total position size of $168 million and an average holding price of $3,201. Even more impressively, it remains a major long position in ETH and XRP on the Hyperliquid platform. Furthermore, Maji's ETH long positions hold $29.46 million, with a profit of $2.03 million, making the long positions appear very strong. However, it's worth noting that the largest short seller of ZEC on the Hyperliquid platform is also increasing its ETH short positions, reaching $48.72 million with a profit of $550,000!
Let's take a look at the technical aspects:
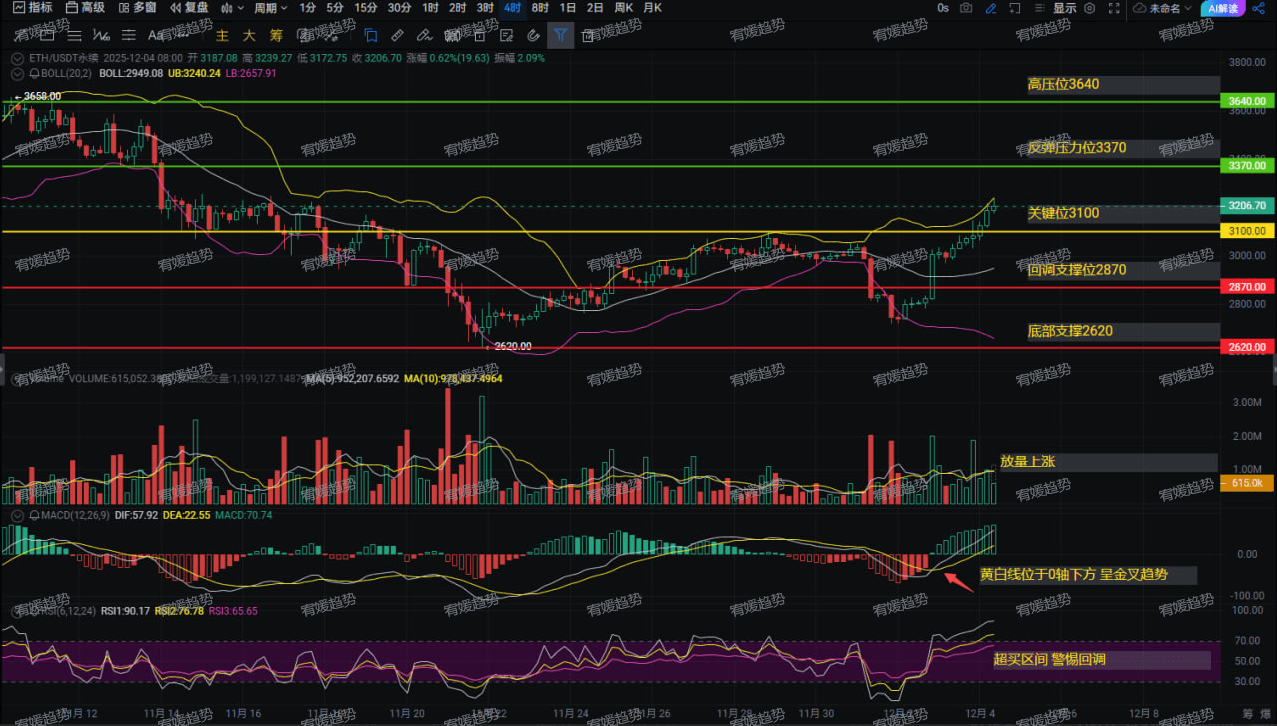
The candlestick chart shows a surge in volume, but the RSI indicator is issuing an overbought warning! On the main chart, the price is generally in an upward trend, currently at $3206, only 164 points away from the intraday resistance level of $3370. There's an even higher resistance level at $3640. Key support levels are at $3100, with a pullback support level at $2870 and a bottom support level at $2620, forming a clear upper and lower trendline.
The MACD sub-chart shows that the white and yellow lines have just crossed below the zero axis, and the MACD value is 70.74, indicating that the short-term buying power is relatively strong, but being below the zero axis means that it has not yet completely escaped the weak zone.
The RSI indicator shows that it has entered the overbought zone, so be wary of a pullback! The volume histogram shows that the price is rising with increasing volume, but being overbought is like driving too fast; you need to apply the brakes.
The MACD golden cross coupled with a surge in volume is like stepping on the gas, but the RSI being overbought and the resistance level of 3370 acting like a red light means stronger buying power is needed to break through. Now that the RSI is overbought, how long can this upward trend last?

My point of view is:
A direct surge to $3640 in the short term is highly unlikely. A more probable scenario is an initial move to around $3370, where resistance will be encountered, followed by a pullback to consolidate and test the strength of the support level below. If it holds, there will be another opportunity to challenge the highs! If you're unsure about specific entry and exit points, follow me. I can provide real-time alerts 24/7 on Youyuan Village. My followers know my alerts are very timely!
Whoever can discern the rhythm of this game will gain the upper hand in the next market move. Want to know how I predict the authenticity of a breakout based on changes in whale positions, and how I use RSI and MACD to pinpoint safe entry points?
Follow me and participate in every attack by Yoo Won! I will post specific entry times and real-time news updates daily in Yoo Won's village! #BTC #ETH


