Core view
Current price: $3,163 (as of December 5, 09:40)
24-hour change: -1.72%
24-hour high: $3,249
24-hour low: $3,072
Short-term outlook: Neutral to bullish
Technical indicators show that the price is stabilizing above the key support level, with a bullish crossover on the 4-hour MACD
Positive sentiment from the Fusaka upgrade supports the short-term trend
On-chain data shows that net outflows are accelerating, with whales continuously accumulating and reducing selling pressure
There is a 55% probability of testing the $3,200-$3,250 range within 24-48 hours
Key support:
First support: $3,111 (1-hour Bollinger Band lower band)
Second support: $3,051 (4-hour middle band)
Third Support: $3,000 (psychological level)
Key Resistance:
First resistance: $3,238 (daily Bollinger band upper limit)
Second resistance: $3,327 (4-hour Bollinger band upper limit)
Third resistance: $3,400 (key technical level)
Technical Analysis
Multi-Cycle Indicator Summary
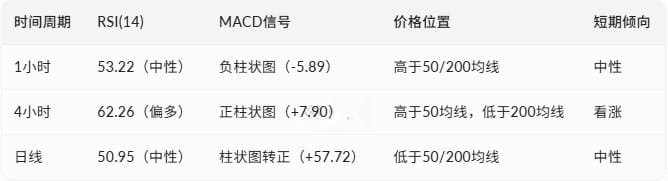
Price Structure
The price is currently trading near $3,163, below the daily Bollinger band upper limit ($3,238), indicating short-term upward testing potential. The 1-hour and 4-hour moving average support is intact, with the price holding the $3,111 key support, laying the foundation for further upward movement. The daily still remains below the long-term moving averages, indicating a need to break $3,407 (50-day moving average) to confirm a trend reversal.
Momentum Indicator
The 4-hour MACD shows a bullish crossover, and the histogram expands to +7.90, indicating strengthened short-term momentum. RSI is at 62.26, nearing overbought but not in a danger zone, with still upward space. The daily MACD histogram turns positive at +57.72, indicating a reduction in downward momentum, creating conditions for a rebound.
Trading Strategy
Long Position Strategy: Confirm above the current price of $3,163, target $3,238 (daily upper limit), stop-loss set at $3,111 (1-hour lower limit).
Short Position Strategy: Enter after falling below $3,111, target $3,051 (4-hour middle limit), stop-loss set at $3,217 (1-hour upper limit).
Breakout Signal: Bullish on volume breakout above $3,238; bearish on daily close below $2,985.
On-chain data analysis
Exchange Fund Flow
On December 4, ETH net outflow was 6,463 coins, continuing the outflow trend over the past 7 days. Exchange reserves decreased from 16,646,884 coins on November 28 to 16,549,495 coins on December 4, a total reduction of 97,389 ETH (about $308 million), indicating that funds continue to flow out of exchanges.
Whale behavior patterns
In the past 7 days, there were net outflows on 6 days, with a single-day outflow of 187,307 coins on November 28 being the largest. Only on December 2 was there a small inflow of 3,420 coins. Ongoing withdrawal behavior from exchanges indicates that whales and institutional investors are actively accumulating at current price levels, reducing market circulation supply.
Selling Pressure Assessment
The overall net outflow trend points to reduced selling pressure, with clear signs of buying accumulation. Large on-chain transaction activity remains relatively stable, with no signs of panic selling.
Market Sentiment and Event-Driven
Core Narrative
Fusaka Upgrade: The Fusaka upgrade activated on December 3 includes 13 Ethereum Improvement Proposals, achieving:
L2 data capacity increased 8 times
Trading costs reduced by 40-60%
Optimized node operation through PeerDAS
Improved fee stability and scalability
After the upgrade, ETH price broke $3,200, then pulled back but overall sentiment remains positive.
Institutional Trends
ETH spot ETF daily inflow reached $140 million, led by BlackRock, providing support for network activity and price. The CFTC approved regulated futures exchanges for spot cryptocurrency trading, and the EU is expanding crypto regulation, both benefiting institutional adoption of ETH.
Social Media Sentiment
Market participants have divergent views on short-term trends:
Bullish faction expects a breakout after surpassing $3,300-$3,400 to extend to $3,800-$3,900.
Cautious faction is concerned about institutional fund flows weakening (government bond buying down more than 80% from August peak) and loss of stablecoin market share.
Technical faction identifies bullish reversal patterns, including 0.618 Fibonacci level support and inverse head and shoulders pattern.
Key opinion leaders emphasize $3,000 as an important support level, with the Fusaka upgrade as a long-term fundamental catalyst.
Risk Factors
Short-term resistance is dense: the $3,100-$3,200 range has accumulated many trapped positions, and a breakout requires volume support.
Long-term moving average pressure: the 50-day and 200-day moving averages are at $3,407 and $3,536 respectively, forming medium to long-term resistance.
Competitive pressure: some stablecoin projects are choosing non-Ethereum chains, which may erode market share.
Institutional inflow slows: although ETFs continue to see inflows, a significant decrease in government bond market buying shows institutional caution.
Conclusion
ETH's short-term trend shows a neutral to bullish pattern. Technically, the price holds key support and the 4-hour momentum is strengthening, creating conditions to test the $3,238 resistance level. On-chain data shows whales continue to accumulate, with selling pressure easing. The fundamental benefits of the Fusaka upgrade and ETF capital inflows create double support.
Within 24-48 hours, if support at $3,111 holds, a challenge to the $3,238-$3,327 range is expected; if broken, it may extend to $3,400. If it falls below $3,111, caution is needed for a pullback to $3,051 or even $3,000. Overall, technical recovery and fundamental improvement provide a basis for a short-term bullish bias, but attention should be paid to selling pressure and volume near resistance levels.
