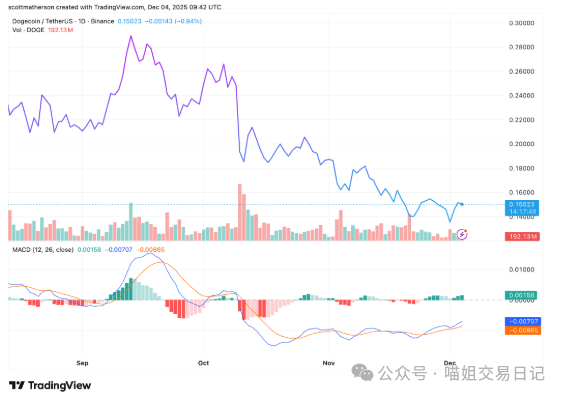
Over the past 30 days, Dogecoin has been mostly declining, presenting a compact and almost predictable rhythm of lower lows and lower highs. Although the movement is slow, technical analysis indicates that some significant trends may be forming.
Cryptocurrency commentator Clifton Fx's new analysis suggests that the downtrend of Dogecoin is about to end. The chart he posted highlights a descending wedge pattern, which could serve as the basis for a 96% increase in Dogecoin if buyers eventually step in decisively.
A wedge shape that is beginning to attract attention
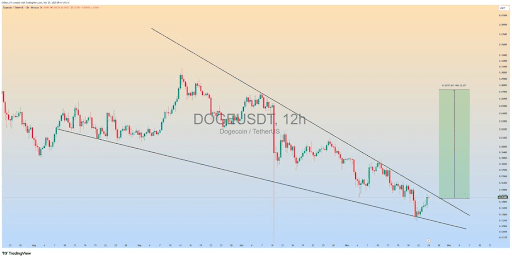
Technical analysis of the price trend of Dogecoin's 12-hour chart shows that two downward-sloping trend lines are gradually converging. The characteristic of this pattern is that the price fluctuates in a winding manner, with each rebound becoming smaller and the distance between the trend lines narrowing.
Analysts often refer to this structure as a descending wedge. It forms in a downtrend, but the narrower the wedge becomes, the more it suggests that sellers are losing control, and buyers are quietly gaining the upper hand.
Clifton Fx also pointed out this development trend in his post, noting that Dogecoin has begun to approach the upper boundary of a wedge pattern. The chart he shared shows that the price has attempted to break through multiple times, which is often seen as an early sign of momentum shift.
Currently, the price trend over the past 48 hours has formed several 12-hour green candlesticks after Dogecoin rebounded from a low of $0.135. This brings Dogecoin's price close to the upper resistance trend line, and its outlook depends on the movement of that resistance line.
Analysts believe that if a strong breakout candlestick occurs at the wedge line, it indicates that the pattern is complete and Dogecoin is ready for a continued rise.
Reasons for the 96% increase
The appeal of this technical pattern lies in the potential for a significant price increase if the breakout is successful. The wedge pattern spans a considerable vertical range, and in technical analysis, the height of the pattern can be used to estimate the rebound magnitude after the breakout.
According to the structure shown in the chart, if a successful breakout occurs, the price is expected to rise 96% from the current level. However, this does not guarantee that the price will rise immediately.
Dogecoin has been under pressure for several weeks, and without strong momentum, a breakout can easily fail. If the trend line can be successfully broken, it is best accompanied by an increase in trading volume, which will help confirm that buyers are gaining control.
Any slowdown in speed or weakening of strength could cause Dogecoin's price to be blocked at the resistance trend line and fall closer to the lower support trend line, which is currently around the midpoint of $0.13.