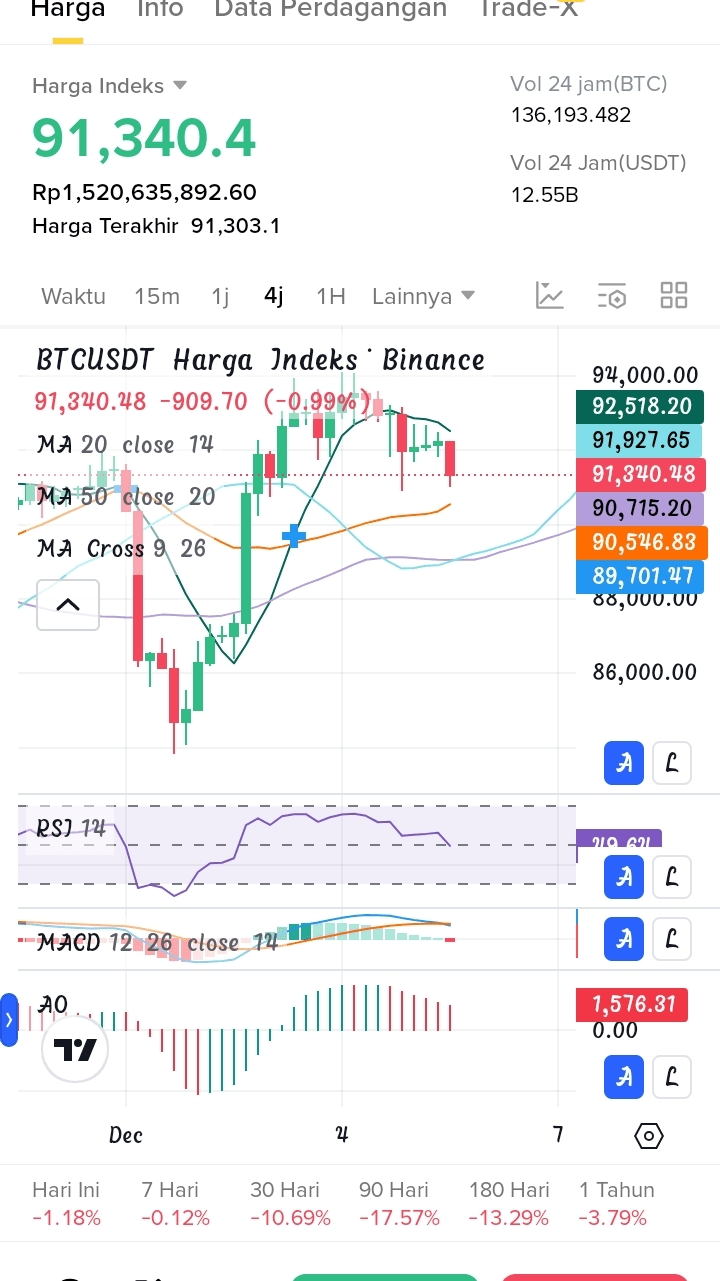
BTCUSDT 4H candlestick chart
Hello Binance Square Community!
The movement of BTCUSDT is back in the spotlight amid the "Extreme Fear" sentiment. With the Fear & Greed Index around 20, many are asking: is this the moment to buy the dip or should we prepare for a deeper correction?

Brief Analysis of BTCUSDT
- Current Price: around $91,340.4 (latest data), down ~0.56% in the last 24 hours.
- Market Sentiment: "Extreme Fear" (F&G 20) often serves as a contrarian signal for potential reversal, but also demands caution.
- Key Levels:
- Important support: $86,000 — if it fails to hold, the next support is around $80,600.
- Initial resistance: $95,000 - $97,000 as a short-term bounce target.
Opportunities & Scenarios
1. Optimistic Scenario (Buy the Dip)
- If BTC holds above $86,000 and technical indicators show reversal (e.g., RSI exiting oversold or bullish divergence), potential rebound towards $95,000–$97,000, even $100,000–$102,000 in the medium term.
2. Conservative Scenario (Wait & See)
- For those who are more cautious, wait for a closing confirmation above $90,000 or $92,000 with supporting volume before opening a position.
3. Pessimistic Scenario (Continued Correction)
- A break below $86,000, especially if it drops below $80,600, may trigger a deeper correction—possibly testing levels around $75,000 or lower.
Trading Recommendations (Reference — DYOR)
- Potential Entry Zone: $83,900 – $86,000 (with reversal confirmation).
- Stop Loss (SL): $79,500 – $80,500.
- Take Profit (TP):
- TP1: $95,000 – $97,000
- TP2: $100,000 – $102,000
- TP3: $120,000 – $125,000 (long-term target if bullish conditions continue, driven by halving and institutional adoption).
Important:
Always do your own research (DYOR) and adjust strategies to your risk profile. The crypto market is very volatile; this post is not financial advice.
#BTCUSDT #bitcoinanalysis2025 #BinanceSquare #TechnicalAnalysis
