Core Viewpoints
Current Price: $3,027 (as of December 6, 10:00, 24-hour drop -4.32%)
Short-term Outlook: Neutral to Bearish. The technical landscape shows intensified bullish and bearish battles, with 1-hour/4-hour levels indicating short-term downward pressure, but daily levels show a MACD divergence signal, suggesting potential rebound possibilities. On-chain net inflow of 123,000 ETH to exchanges increases selling pressure, attention is needed to see if the $2960 support can hold. If it stabilizes above $3050, it is expected to test the $3100-3179 resistance zone.
Key Support:
Recent Support: $2960-3000 (Bollinger Band lower track + large long liquidation zone)
Strong support: $2,918-$2,950 (accumulated $587 million long liquidation concentration area, falling below may trigger a chain reaction)
Key resistance:
Recent resistance: $3,050-$3,100 (short-term moving average cluster + $725 million short liquidation concentration area)
Strong resistance: $3,179-$3,210 (1-hour/daily Bollinger Bands upper limit, breakthrough requires volume confirmation)
Technical analysis
Multi-timeframe price structure
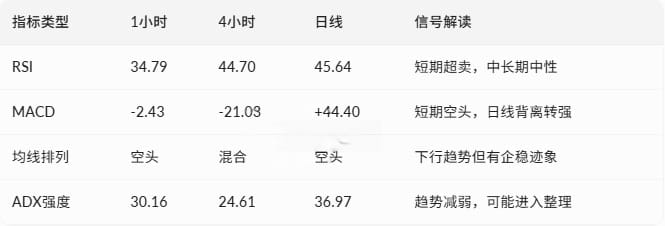
1-hour level: Price is running below EMA12 ($3,042) and EMA26 ($3,075), with RSI dropping to 34.79 near oversold territory, and a MACD negative bar of -2.43 showing ongoing downward pressure. ADX is at 30.16, confirming a moderately strong downtrend.
4-hour level: Price is slightly above SMA50 ($3,016) but below dual moving average systems, RSI at 44.70 is in a neutral range, and MACD negative bar at -21.03 maintains a bearish crossover, while ADX at 24.61 reflects a weak oscillating pattern.
Daily level: Price is below all major moving averages (EMA12 $3,027, EMA26 $3,114, SMA50 $3,388), but MACD bars have turned positive at +44.40, forming a potential bottom divergence signal. ADX at 36.97 shows the trend remains bearish, but momentum is weakening.
Comprehensive signal from technical indicators
Derivatives market
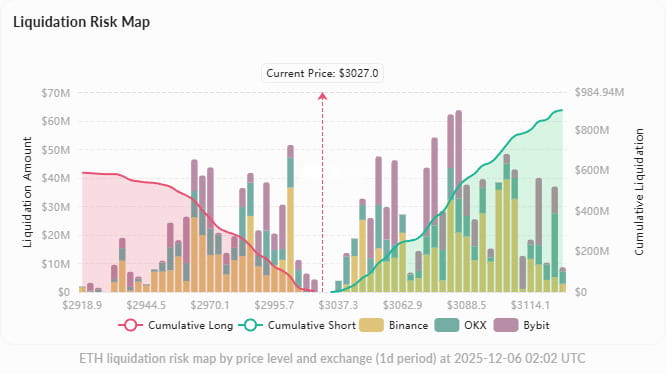
Positions and liquidations: Total open interest is $37.02 billion, down 2.93% in the last 24 hours, indicating a cooling market after leveraged liquidations. In terms of liquidation risk, there is a cumulative $587 million long liquidation pressure below $2,960, and falling below this level will trigger a chain liquidation; whereas above $3,050, a $725 million short liquidation zone may drive a rebound.
Funding rate: Binance +0.00549% (longs paying), OKX -0.00493% (shorts paying), reflecting a relatively balanced long and short power, slightly leaning towards cautious longs.
On-chain data
Exchange flow: On December 5, there was a net inflow of 123,000 ETH to exchanges, with total inflows of 881,000 and outflows of 757,000, indicating increased short-term selling pressure. Total reserves on exchanges dropped to 16.67 million ETH (worth $5.23 billion), a decrease of 470,000 from the previous week, with sustained outflows in the medium to long term supporting the accumulation narrative.
Whale activity:
At 11:22 UTC, transferred 119,000 ETH (approximately $36 million) to address 0x28c6c..., coinciding with early price volatility.
Continuously transferred 60,000 and 59,000 ETH to the same address, corresponding to prices falling from $3,141 to $3,105.
Multiple outflows of 17,500 ETH dispersed, with prices simultaneously dropping to $3,022.
Whale behavior shows that large holders are both accumulating (119,000 inflows) and distributing (multiple outflows of 17,500) during price corrections, with mixed signals reflecting market divergence.
Market sentiment
Social media sentiment: Twitter/X discussions show mixed trends, with bullish views emphasizing technical support rebounds and whale accumulation on dips, while bearish views focus on ETH weakening relative to BTC and institutional fund outflows. ETF data shows zero flow for Grayscale ETHE on December 6, while some low-fee products still have net inflows, indicating selective differentiation in institutional demand.
Market narrative:
Technical analysts focus on key weekly support rebounds, believing that breakout patterns are preferable to short-term corrections.
Fundamental discussions focus on expectations for the December Fusaka upgrade, with L2 efficiency improvements potentially boosting confidence.
Macroeconomic concerns regarding the uncertainty of Federal Reserve policies and the rising dominance of BTC suppressing altcoins.
Today's trend analysis
Scenario One (Probability 60%) - Consolidation: Maintaining a range of $2,960-$3,100, waiting for directional choice. Technical daily divergence requires time to repair, while short-term net inflows on-chain suppress rebound space, but strong support at $2,960 and whale accumulation provide downside protection.
Scenario Two (Probability 25%) - Upward Break: If it stabilizes above $3,050 and breaks out above $3,100 with volume, it will trigger $725 million in short liquidations, targeting resistance zones of $3,179-$3,210. This needs to be accompanied by a rebound in open interest and a positive shift in funding rates.
Scenario Three (Probability 15%) - Downward Break: Falling below $2,960 will trigger $587 million in long liquidations, targeting the strong support at $2,918. Continuous net inflows to exchanges and macro risk events should be monitored.
Operational advice: $2,960-$3,000 is a key defensive zone; maintaining this could allow for buying on dips, with stop-loss set at $2,940; after confirming a breakout above $3,050, chasing higher prices is recommended with targets of $3,100/$3,179, and stop-loss at $3,020. High leverage traders should be aware of concentrated liquidation risk areas.


