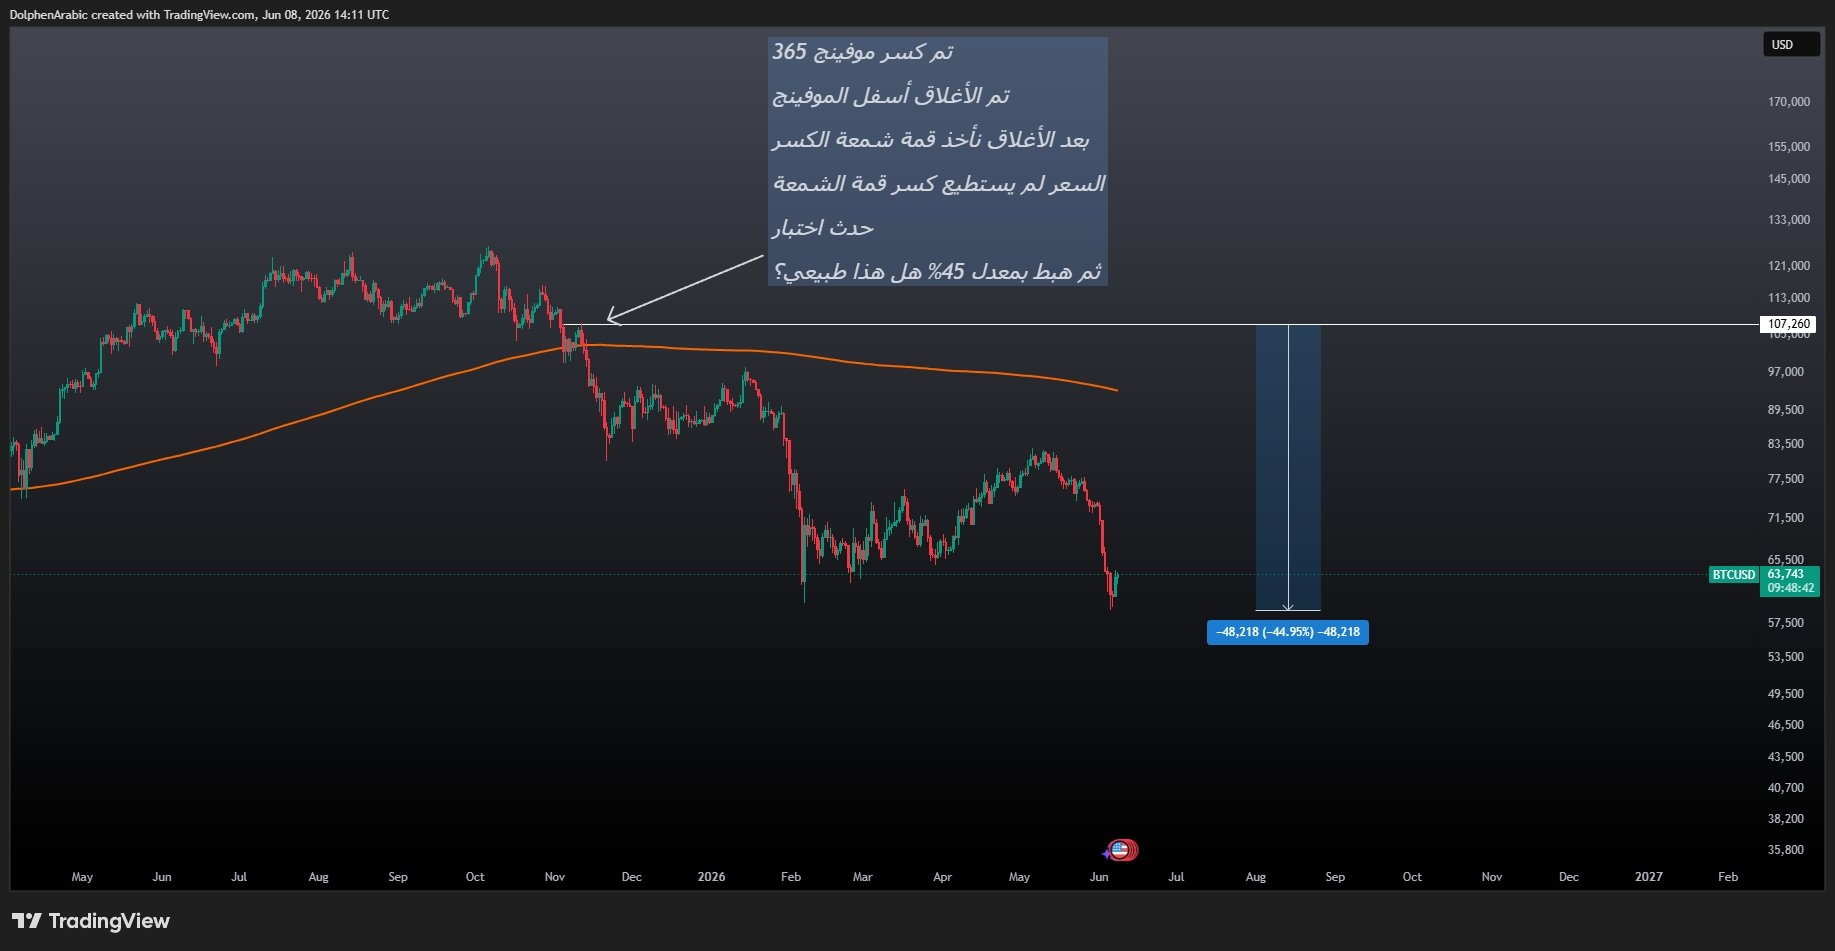
After years of watching and analyzing, I've found that one of the simplest and most accurate indicators is the 365-day moving average.
✅ When the price keeps trading above it, the buyers usually have the upper hand.
✅ And when it breaks below and stabilizes, the chances of a trend weakening increase.
Interestingly, the price interaction with the 365-day moving average has often been clearer than the popular 50 and 200 averages.
💡 Open the chart now and add MA 365, then let me know:
Have you ever noticed the strength of this moving average in analyzing Bitcoin? $ETH

BTC
60,912.42
-2.84%