
The current PAXG market is showing a weak oscillation pattern, with spot prices slightly below the key MA200 moving average, but trading volume has significantly increased, and there is notable buying pressure in the order book. The funding rate in the futures market is close to neutral, but trading volume has sharply declined, indicating that derivative traders are cautious and the market is at a critical point of directional choice.
Key prices and range structure
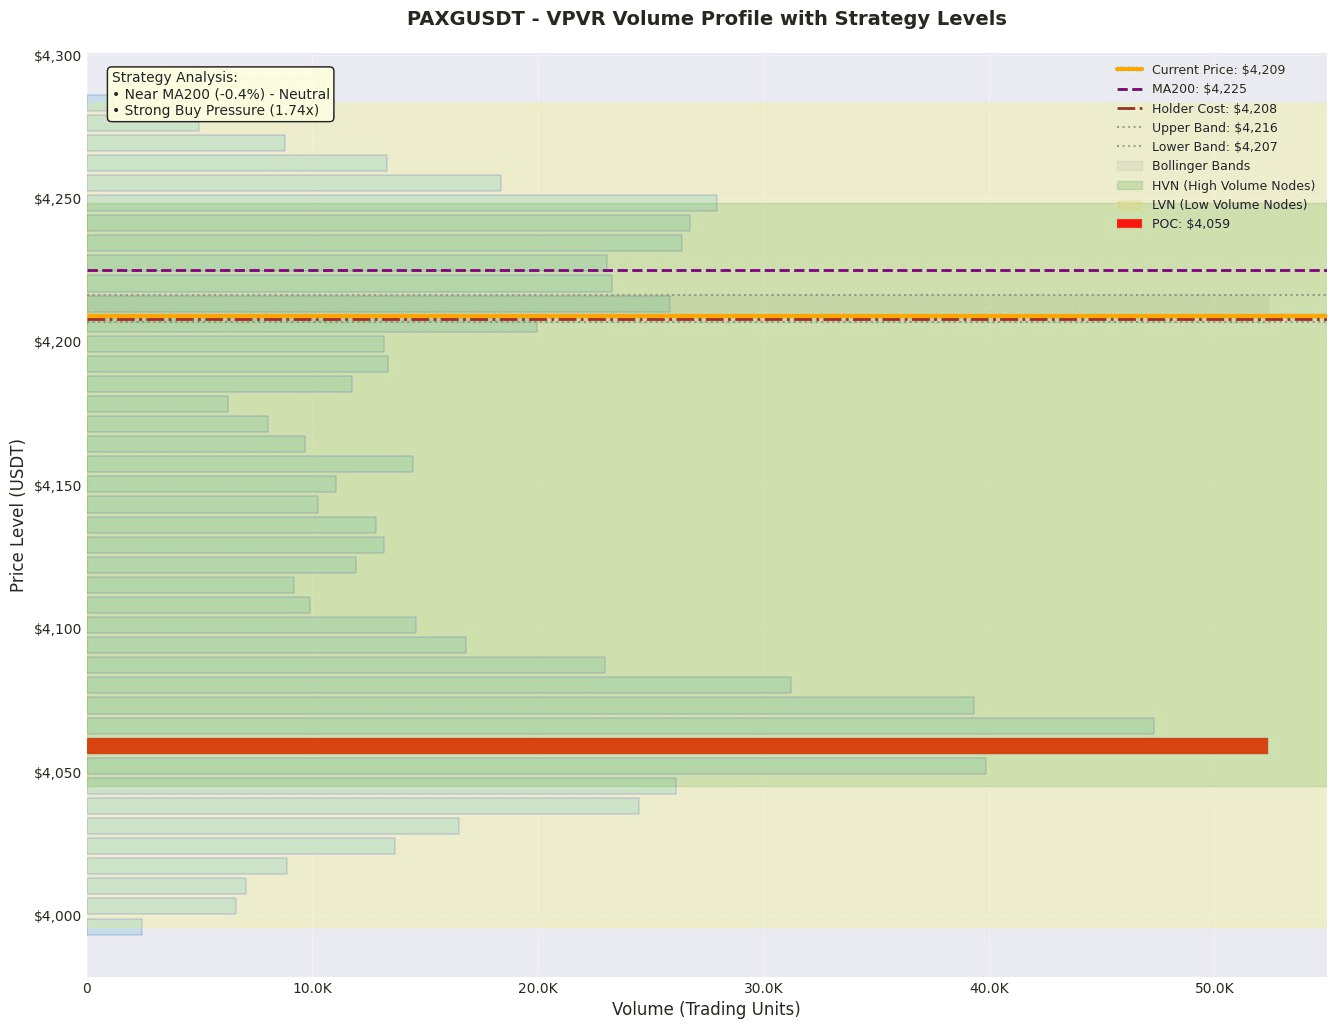
1. Value anchoring area: According to VPVR data, the 'value anchor' (POC) for this round of games is at 4059.15, while the value area (Value Area) ranges from 4031.11 to 4255.37. The current price of 4208.88 is near the upper edge of the value area, indicating that the market is trying to return from below to the value range. 4255.37 (VAH) is an important short-term resistance level, while 4031.11 (VAL) is the core support area.
2. Trend and Volatility Range: The current price of 4208.88 is about 0.4% below MA200 (4224.87), indicating a weak medium to long-term trend. The Bollinger Band range is from 4206.99 to 4216.27, with the price near the lower Bollinger Band (20.3% percentile), suggesting potential short-term overselling and converging volatility.
3. High Volume / Concentrated Order Area (HVN): The static POC (4059.15) is a historical high volume area that constitutes strong support. Additionally, the order book shows concentrated buy orders at 4160.0 and 4150.0 (totaling 571K USDT), forming a recent buying defense line. The main selling pressure above is concentrated at 4750.0 and 10000.0, which are relatively distant, indicating less short-term resistance.
Derivatives and Liquidity Analysis
Contract market trading volume plummeted by 60.8%, while open interest (OI) remained stable (76.53M), with an extremely high OI/market cap ratio (107869.59%). This typically indicates that high leveraged funds are still in the market, but trading activity has dropped sharply, and the market may enter a 'silent period' after liquidity exhaustion, easily leading to severe fluctuations due to sudden news or large orders. The funding rate is close to zero (-0.00000928), with the long/short ratio slightly decreasing from 1.4226 to 1.4050, showing that leveraged funds are relatively balanced, with no extreme crowding. In this environment, it is not suitable to increase leverage; it is recommended to trade primarily with low leverage or spot and closely monitor whether trading volume can recover.
News and Event Impact
Currently, there are no major news events. The provided news summaries are all routine market data updates and information aggregation pages, and do not include specific events or fundamental news that could drive price changes. Market sentiment is mainly influenced by technical factors and macro liquidity.
Trading Strategy
Plan 1: Conservative / Value Rebound Long Strategy
• Direction: Long
• Logic: Price is at the upper edge of the value area and close to the lower Bollinger Band and MA200, indicating a technical rebound demand. There is significant buying pressure on the order book (buy/sell pressure ratio 1.74x), with dense buy orders providing support below.
• Entry Range: Enter in batches between 4206.99 (Bollinger Band lower band) and 4160.0 (major buy units).
• Stop Loss: 4130.0 (below the major buy order dense area and VAL support).
• Target: First target 4255.37 (VAH resistance), second target 4300.0 (integer level and extension of the Bollinger Band upper band).
• Expected Risk/Reward Ratio: Based on entry at 4210, stop loss at 4130, target at 4255, risk 80, profit 45, the risk/reward ratio is approximately 1:0.56. This strategy has a relatively low risk/reward ratio, and the core logic is betting on price stabilizing in the support area, suitable for small positions.
Plan 2: Aggressive / Shorting Below Support Strategy
• Direction: Short
• Logic: If the price effectively breaks below the lower edge of the value area (VAL) and the dense buy order area, it may open up downward space, seeking support at the static POC.
• Entry Condition: Price breaks below 4150.0 (key buy unit) with volume and confirms.
• Stop Loss: 4200.0 (above the original support area).
• Target: 4059.15 (strong support at POC).
• Expected Risk/Reward Ratio: Based on entry at 4145, stop loss at 4200, target at 4060, risk 55, profit 85, the risk/reward ratio is approximately 1:1.55. This strategy requires waiting for a clear breakout signal, with a relatively better risk/reward ratio.
Risk Warning and Position Management
1. Liquidity Risk: Contract trading volume plummeted by 60.8%, market depth is insufficient, large orders may trigger price crashes or spikes, and stop loss orders may execute at poor prices.
2. High Leverage Risk: The OI/market cap ratio is as high as 107869.59%, indicating a very high proportion of leveraged funds in the market. Once prices fluctuate sharply in the opposite direction, it may trigger a chain of forced liquidations, exacerbating volatility.
3. Trend Continuation Risk: Prices remain below MA200, with an overall weak trend, and rebounds may only be a continuation of the downtrend.
Position Management Suggestions:
• Given the decline in liquidity and potential for high volatility, the use of high leverage is strictly prohibited. It is recommended that total risk exposure does not exceed 5% of account capital.
• Use a batch building strategy, especially in the support area of Plan 1, entering in 2-3 batches to average costs.
• If contract trading volume remains sluggish or funding rates deviate significantly (e.g., turning negative quickly), one should proactively reduce positions or switch to a wait-and-see approach, waiting for market sentiment and liquidity to recover.
Like and follow for real-time updates!
$PAXG
